OPEN-SOURCE SCRIPT
업데이트됨 [JHF] Asset Performance Ratio
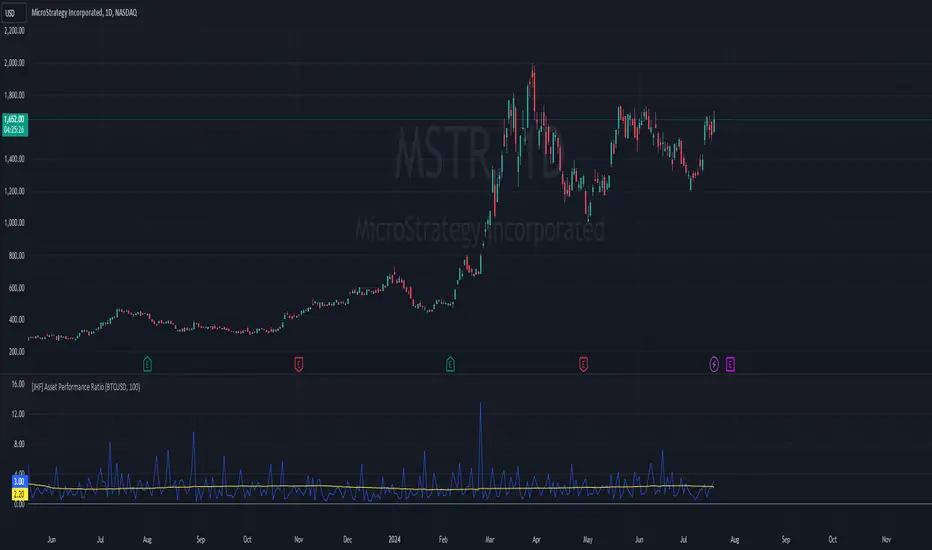
The Asset Performance Ratio indicator compares the performance of the current chart's asset (Asset 1) with a baseline asset (Asset 2). This indicator calculates the candle range for both assets in percentage terms and computes the multiplier of Asset 1's range relative to Asset 2's range. It also provides a moving average of this multiplier over a specified period.
Features:
Inputs:
How It Works:
Example Use Case:
Use this indicator to compare the volatility or performance of a stock against a cryptocurrency, providing insights into their relative movements and aiding in making informed trading decisions.
Features:
- Baseline Asset Selection: Choose any asset as the baseline for comparison.
- Period Customization: Set the period for the moving average to suit your analysis.
- Dynamic Calculation: Automatically uses the current chart's ticker as Asset 1.
- Visual Representation: Plots both the multiplier and its moving average for easy interpretation.
Inputs:
- Baseline Asset (Default: BTCUSD): The ticker symbol of the baseline asset against which the current chart's asset is compared.
- Period (Default: 100): The number of periods over which the moving average of the multiplier is calculated.
How It Works:
- Candle Data Retrieval:
- The script fetches high, low, open, and close prices for both the current chart's asset and the baseline asset.
- Percentage Range Calculation:
- Calculates the candle range as a percentage of the opening price for both assets.
- Multiplier Calculation:
- Computes the multiplier as the ratio of the percentage range of the current chart's asset to that of the baseline asset.
- Moving Average Calculation:
- Calculates the simple moving average (SMA) of the multiplier over the specified period.
- Plotting:
- Plots the multiplier and its moving average for easy visual comparison.
Example Use Case:
Use this indicator to compare the volatility or performance of a stock against a cryptocurrency, providing insights into their relative movements and aiding in making informed trading decisions.
릴리즈 노트
Updated Chart.릴리즈 노트
Updated labels오픈 소스 스크립트
트레이딩뷰의 진정한 정신에 따라, 이 스크립트의 작성자는 이를 오픈소스로 공개하여 트레이더들이 기능을 검토하고 검증할 수 있도록 했습니다. 작성자에게 찬사를 보냅니다! 이 코드는 무료로 사용할 수 있지만, 코드를 재게시하는 경우 하우스 룰이 적용된다는 점을 기억하세요.
The Real World - Stocks Campus:
Stocks, Options, Futures, Forex, Crypto, this is what we trade.
Learn profitable trading systems or build your own, just like I did.
jointherealworld.com/?a=tkbmft8bqf
Stocks, Options, Futures, Forex, Crypto, this is what we trade.
Learn profitable trading systems or build your own, just like I did.
jointherealworld.com/?a=tkbmft8bqf
면책사항
해당 정보와 게시물은 금융, 투자, 트레이딩 또는 기타 유형의 조언이나 권장 사항으로 간주되지 않으며, 트레이딩뷰에서 제공하거나 보증하는 것이 아닙니다. 자세한 내용은 이용 약관을 참조하세요.
오픈 소스 스크립트
트레이딩뷰의 진정한 정신에 따라, 이 스크립트의 작성자는 이를 오픈소스로 공개하여 트레이더들이 기능을 검토하고 검증할 수 있도록 했습니다. 작성자에게 찬사를 보냅니다! 이 코드는 무료로 사용할 수 있지만, 코드를 재게시하는 경우 하우스 룰이 적용된다는 점을 기억하세요.
The Real World - Stocks Campus:
Stocks, Options, Futures, Forex, Crypto, this is what we trade.
Learn profitable trading systems or build your own, just like I did.
jointherealworld.com/?a=tkbmft8bqf
Stocks, Options, Futures, Forex, Crypto, this is what we trade.
Learn profitable trading systems or build your own, just like I did.
jointherealworld.com/?a=tkbmft8bqf
면책사항
해당 정보와 게시물은 금융, 투자, 트레이딩 또는 기타 유형의 조언이나 권장 사항으로 간주되지 않으며, 트레이딩뷰에서 제공하거나 보증하는 것이 아닙니다. 자세한 내용은 이용 약관을 참조하세요.