PROTECTED SOURCE SCRIPT
TDS9 Counting (Red & Blue, Offset Labels)
Here’s a polished, **publication‑ready narrative** for your *TDS9 Counting (Red & Blue, Offset Labels)* indicator, written in the same style as the previous ones:
---
**TDS9 Counting (Red & Blue, Offset Labels)**
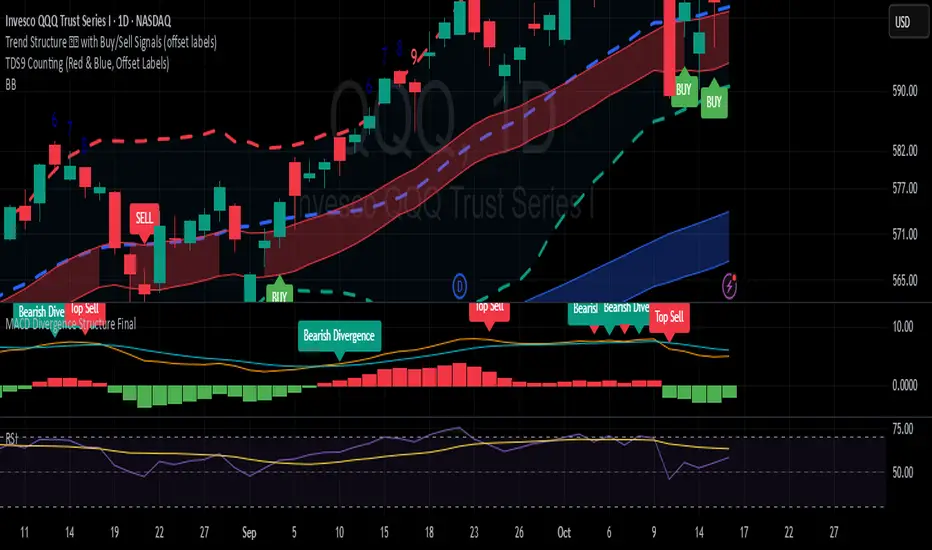
This indicator implements a sequential counting method to help traders identify potential exhaustion points in ongoing trends. It tracks sequences of price closes relative to the prior 4 bars, building up to a **9‑count structure** that often signals areas where momentum may be weakening and a reversal or pause could occur.
The script automatically labels counts **6 through 9** directly on the chart, with clear **color‑coded markers**:
- **Red numbers** for downward sequences (bearish setups)
- **Dark blue numbers** for upward sequences (bullish setups)
- A **red “9”** highlights a potential exhaustion point in an uptrend, while a **blue “9”** marks exhaustion in a downtrend
To maintain chart clarity, labels are **offset slightly above or below candles** using dynamic spacing, ensuring signals remain visible without overlapping price action. This makes it easy to track the progression of counts in real time while keeping the chart clean and readable.
By combining structured sequential logic with intuitive visual cues, this tool helps traders:
- Monitor developing **trend exhaustion patterns**
- Anticipate potential **reversal or consolidation zones**
- Add a **systematic layer of confirmation** to existing strategies
- Keep charts uncluttered with offset, color‑coded labels
Whether you’re a discretionary trader looking for exhaustion confirmation or a systematic trader layering signals into a broader strategy, this indicator provides a **clear, structured framework** for spotting potential turning points in price action.
---
**TDS9 Counting (Red & Blue, Offset Labels)**
This indicator implements a sequential counting method to help traders identify potential exhaustion points in ongoing trends. It tracks sequences of price closes relative to the prior 4 bars, building up to a **9‑count structure** that often signals areas where momentum may be weakening and a reversal or pause could occur.
The script automatically labels counts **6 through 9** directly on the chart, with clear **color‑coded markers**:
- **Red numbers** for downward sequences (bearish setups)
- **Dark blue numbers** for upward sequences (bullish setups)
- A **red “9”** highlights a potential exhaustion point in an uptrend, while a **blue “9”** marks exhaustion in a downtrend
To maintain chart clarity, labels are **offset slightly above or below candles** using dynamic spacing, ensuring signals remain visible without overlapping price action. This makes it easy to track the progression of counts in real time while keeping the chart clean and readable.
By combining structured sequential logic with intuitive visual cues, this tool helps traders:
- Monitor developing **trend exhaustion patterns**
- Anticipate potential **reversal or consolidation zones**
- Add a **systematic layer of confirmation** to existing strategies
- Keep charts uncluttered with offset, color‑coded labels
Whether you’re a discretionary trader looking for exhaustion confirmation or a systematic trader layering signals into a broader strategy, this indicator provides a **clear, structured framework** for spotting potential turning points in price action.
보호된 스크립트입니다
이 스크립트는 비공개 소스로 게시됩니다. 하지만 이를 자유롭게 제한 없이 사용할 수 있습니다 – 자세한 내용은 여기에서 확인하세요.
면책사항
해당 정보와 게시물은 금융, 투자, 트레이딩 또는 기타 유형의 조언이나 권장 사항으로 간주되지 않으며, 트레이딩뷰에서 제공하거나 보증하는 것이 아닙니다. 자세한 내용은 이용 약관을 참조하세요.
보호된 스크립트입니다
이 스크립트는 비공개 소스로 게시됩니다. 하지만 이를 자유롭게 제한 없이 사용할 수 있습니다 – 자세한 내용은 여기에서 확인하세요.
면책사항
해당 정보와 게시물은 금융, 투자, 트레이딩 또는 기타 유형의 조언이나 권장 사항으로 간주되지 않으며, 트레이딩뷰에서 제공하거나 보증하는 것이 아닙니다. 자세한 내용은 이용 약관을 참조하세요.