OPEN-SOURCE SCRIPT
Indicator: Forecast Oscillator & a BB extrapolation experiment
FOSC (Forecast Oscillator, %F) is implemented as explained by Kaufman (there are lot of representations out there, using linregs, this one is not.).
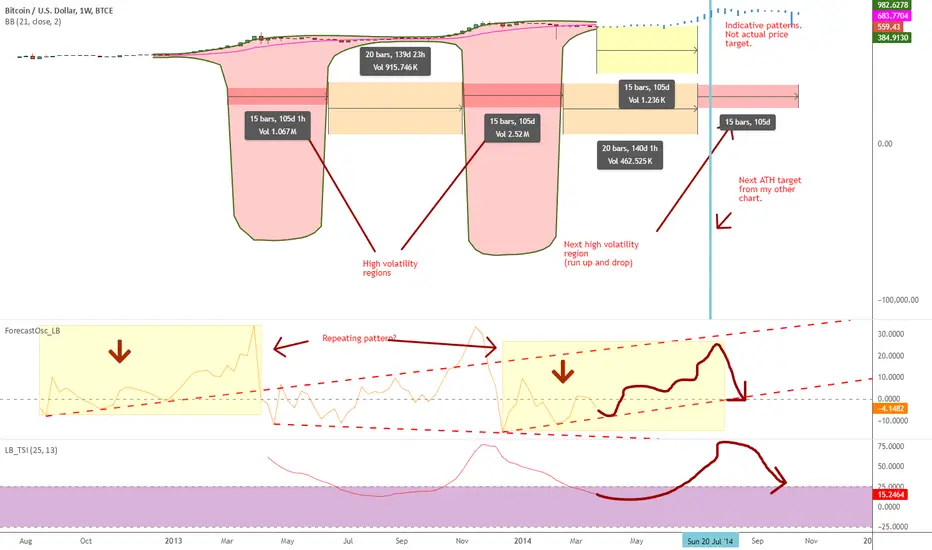
This indicator plots a 3-period smoothing of %F. When %F = 0, the trend line and prices are moving parallel to one another; when %F is above 0 the market is accelerating away from the trend line; when %F is below 0 prices are slowing down and the two series are converging.
Now on to the BB extrapolation: As you can see above, a 21-period BB on 1W shows 2 volatile areas of same length. Simple projection using the same time periods gives us a similar volatile area in another 105d. FOSC is forming a similar pattern now as of the first area. More information in the chart markings.
Interesting thing for me was how my other chart (tradingview.com/v/HeSyTev8/) aligned with this. Lets see how far these timelines are respected.
In the mean time, feel free to "Make mine" this and use FOSC in your charts. Appreciate any feedback / comments.
오픈 소스 스크립트
트레이딩뷰의 진정한 정신에 따라, 이 스크립트의 작성자는 이를 오픈소스로 공개하여 트레이더들이 기능을 검토하고 검증할 수 있도록 했습니다. 작성자에게 찬사를 보냅니다! 이 코드는 무료로 사용할 수 있지만, 코드를 재게시하는 경우 하우스 룰이 적용된다는 점을 기억하세요.
List of my free indicators: bit.ly/1LQaPK8
List of my indicators at Appstore: blog.tradingview.com/?p=970
List of my indicators at Appstore: blog.tradingview.com/?p=970
면책사항
해당 정보와 게시물은 금융, 투자, 트레이딩 또는 기타 유형의 조언이나 권장 사항으로 간주되지 않으며, 트레이딩뷰에서 제공하거나 보증하는 것이 아닙니다. 자세한 내용은 이용 약관을 참조하세요.