INVITE-ONLY SCRIPT
Ocean's Smart Structure [Pro]
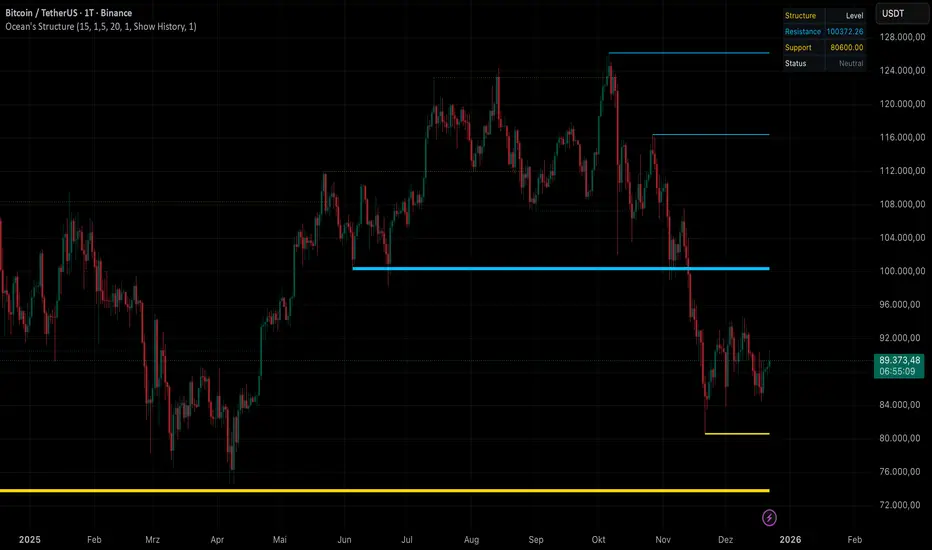
Ocean's Smart Structure [Pro] – Professional Market Architecture
Stop guessing where the liquidity is.
Ocean's Smart Structure [Pro] is a next-generation technical analysis suite designed for precision traders. Unlike standard pivot indicators that clutter your chart with noise, it uses a Volatility-Adaptive Clustering Algorithm to merge, filter, and validate the levels that actually matter.
It doesn't just draw lines; it understands market behavior. It detects when support flips to resistance, identifies liquidity grabs (fakeouts), and visually indicates the strength of every zone.
🌊 Key Features
1. Volatility-Adaptive Clustering
Markets expand and contract. Standard indicators fail because they use static values. It calculates the Average True Range (ATR) in real-time to determine the effective width of a zone.
Result: Nearby pivots are intelligently merged into single, robust "Structural Clusters."
2. Advanced Role Reversal (Flip Logic)
Price rarely respects a level once. When a strong Support breaks, it often becomes Resistance.
The Logic: The indicator automatically flips lines from Support (Gold) to Resistance (Blue) upon a confirmed break, keeping the history of that price level alive on your chart.
3. Institutional Fakeout Protection
The unique selling point of this tool. Algorithms often push price past a level to trigger stop-losses before reversing.
Standard Indicators: Delete the level immediately upon a break.
This Tool: Enters a "Pending Break" state. If the next candle reclaims the level, the line is preserved and strengthened, marking it as a Liquidity Grab rather than a breakout.
4. Dynamic Strength Visualization
Not all levels are equal.
Visual Feedback: As a level is tested more times without breaking, the line automatically becomes thicker. This allows you to instantly identify "Concrete Walls" vs. "Glass Windows" at a glance.
5. Real-Time HUD (Heads-Up Display)
A clean, non-intrusive dashboard sits on your chart, providing instant context:
Nearest Resistance & Support: Exact price ticks.
Live Status: Tells you if price is "Ranging," "At Support," or "At Resistance" based on volatility proximity.
⚙️ Settings & Customization
Pivot Period: Adjust sensitivity to swing highs/lows.
Cluster Sensitivity: Controls how aggressive the merging algorithm is.
Role Reversal Limit: Limit how many times a level can flip (preventing infinite ping-pong lines).
Invalidation Action: Choose to delete broken lines or keep them as "Ghost Levels" (dotted history).
Visuals: Fully customizable branding colors (Default: Gold & Neon Blue).
초대 전용 스크립트
이 스크립트는 작성자가 승인한 사용자만 접근할 수 있습니다. 사용하려면 요청 후 승인을 받아야 하며, 일반적으로 결제 후에 허가가 부여됩니다. 자세한 내용은 아래 작성자의 안내를 따르거나 ofean에게 직접 문의하세요.
트레이딩뷰는 스크립트의 작동 방식을 충분히 이해하고 작성자를 완전히 신뢰하지 않는 이상, 해당 스크립트에 비용을 지불하거나 사용하는 것을 권장하지 않습니다. 커뮤니티 스크립트에서 무료 오픈소스 대안을 찾아보실 수도 있습니다.
작성자 지시 사항
면책사항
해당 정보와 게시물은 금융, 투자, 트레이딩 또는 기타 유형의 조언이나 권장 사항으로 간주되지 않으며, 트레이딩뷰에서 제공하거나 보증하는 것이 아닙니다. 자세한 내용은 이용 약관을 참조하세요.