INVITE-ONLY SCRIPT
업데이트됨 TwP: Financials on Charts
With this indicator, you can see the following on a chart:
> An Info Panel, with the financial snapshot of the company, such as its market capitalization, annual & quarterly financials, Y/Y growth numbers, profitability margins, RoE & RoCE, and valuation ratios.
> EBITDA and PAT margins over a period of time.
> RoE and RoCE ratios over a period of time.
> Valuation multiples over a period of time.
> A comparison of margins, return ratios, and valuation multiples with any peer-group company.
Info Panel
This gives a quick snapshot of the financials of the company, which includes annual & quarterly Revenue, EBITDA, PAT, margins with Y/Y changes, Debt-Equity ratio, ROE, ROCE, and valuation multiples.

Profitability & Return Ratios
You can view quarterly as well as annual EBITDA & PAT margins and annual RoE, RoCE. You can choose to see these ratios either only for the company or can also add a peer company to compare.

Valuation Ratios
You can view TTM valuation ratios such as EV/Sales, EV/EBITDA, P/BV & P/E multiples. You can choose to see these valuation multiples either only for the company or can also add a peer company to compare.


> An Info Panel, with the financial snapshot of the company, such as its market capitalization, annual & quarterly financials, Y/Y growth numbers, profitability margins, RoE & RoCE, and valuation ratios.
> EBITDA and PAT margins over a period of time.
> RoE and RoCE ratios over a period of time.
> Valuation multiples over a period of time.
> A comparison of margins, return ratios, and valuation multiples with any peer-group company.
Info Panel
This gives a quick snapshot of the financials of the company, which includes annual & quarterly Revenue, EBITDA, PAT, margins with Y/Y changes, Debt-Equity ratio, ROE, ROCE, and valuation multiples.
Profitability & Return Ratios
You can view quarterly as well as annual EBITDA & PAT margins and annual RoE, RoCE. You can choose to see these ratios either only for the company or can also add a peer company to compare.
Valuation Ratios
You can view TTM valuation ratios such as EV/Sales, EV/EBITDA, P/BV & P/E multiples. You can choose to see these valuation multiples either only for the company or can also add a peer company to compare.
릴리즈 노트
- Added option to see chart for certain line items (Revenue, EBITDA and PAT) on Annual & Quarterly basis.
*Added a Note in the Settings box to clarify that Line items can be seen on annual & quarterly basis; Under Ratios, Profit margins can be seen on annual & quarterly basis; RoE and ROCE are on the basis of last Financial Year; and Valuation Ratios are on Trailing Twelve Months (TTM) basis.
릴리즈 노트
- EBITDA and PAT margins can now be seen separately.- ROE and ROCE also can now be seen separately.
- Changed the default colors for better peer company comparison.
- Removed unwanted code.
릴리즈 노트
Added change in Quarterly Sales and EPS data.릴리즈 노트
Corrected a silly error.릴리즈 노트
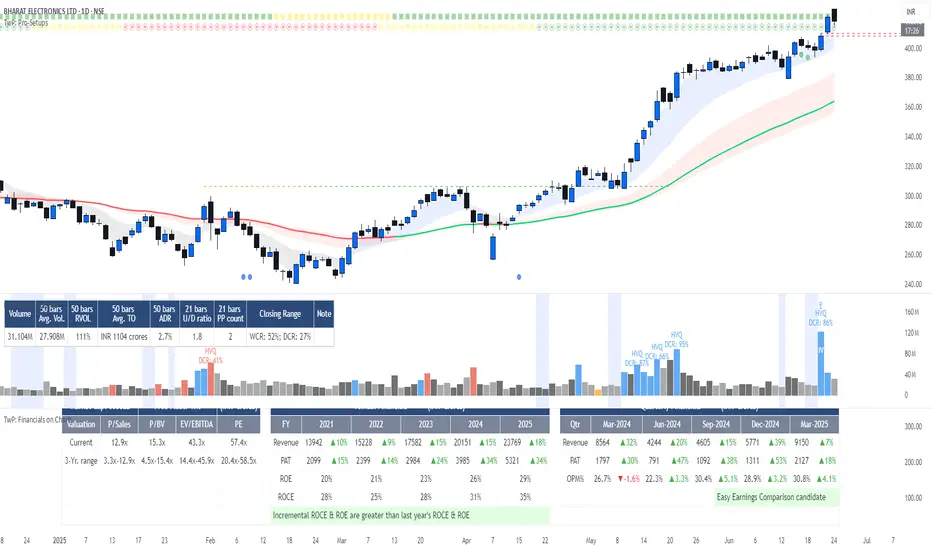
This script needed modification since the introduction of Tables in Pinescript. Hence, revamped the whole script.There are three tables that get printed on your chart:
• Table 1: This gives you information on the market cap, free float, current valuation and 3-year valuation range.
• Table 2: Annual financial numbers.
• Table 3: Quarterly financial numbers.
Plus, Table 3 also tells you if the company has accelerated sales and earnings in last two-three quarters, or is meeting Code 33 condition as laid out by Mark Minervini.
From the settings tab, you can:
- Change the scale for the financial numbers (Billion, Million, Crores, Lakhs, None).
- Adjust the size of the tables to fit in your chart.
- Change the color of the table and text.
릴리즈 노트
Fixed a minor bug related to the note on sales & earnings acceleration.릴리즈 노트
Added tiny, small and auto size options to fix the resolution issue.릴리즈 노트
Option to see Key Notes instead of FinancialsThis update is useful for those who are not interested in looking at the whole financial table, but still want to know the company's performance and potential such as Accelerated Earnings, Code 33 or Easy Earnings Comparison.
From the Settings, you can choose to see only the Key Notes, instead of the Financials Summary. This will only print Key Notes, if any, like in the chart below:
You can move up the Key Notes part to the Pro-Setups or Volume Script too.
릴리즈 노트
Added option to place Key Notes to any corner of the layout.릴리즈 노트
Small bug related to the first Quarter name is now corrected.릴리즈 노트
Added note for cases where Incremental ROCE or ROE is greater than ROCE or ROE of previous year. Incremental ROCE or ROE higher than last year's ROCE or ROE suggests the company is generating better returns on its new investments or equity, indicating improved capital allocation efficiency and stronger profitability from recent growth initiatives. You can see the same explanation as a tooltip as well.Where previous year's financials were not available, the table used to show '1970' as the year. This has been corrected and the table header in such cases will show blank now.
초대 전용 스크립트
이 스크립트는 작성자가 승인한 사용자만 접근할 수 있습니다. 사용하려면 요청을 보내고 승인을 받아야 합니다. 일반적으로 결제 후에 승인이 이루어집니다. 자세한 내용은 아래 작성자의 지침을 따르거나 Pro-Setups에게 직접 문의하세요.
트레이딩뷰는 스크립트 작성자를 완전히 신뢰하고 스크립트 작동 방식을 이해하지 않는 한 스크립트 비용을 지불하거나 사용하지 않는 것을 권장하지 않습니다. 무료 오픈소스 대체 스크립트는 커뮤니티 스크립트에서 찾을 수 있습니다.
작성자 지시 사항
Please visit our website for getting access to the script.
경고: 액세스를 요청하기 앞서 초대 전용 스크립트에 대한 가이드를 읽어주세요.
Pro-Setups is meant for Swing and Positional Trading. It is a combination of scripts on TradingView, and a screener Dashboard on web. Whatever you scan on Dashboard, you can see the same on your charts.
For details, please visit pro-setups.com
For details, please visit pro-setups.com
면책사항
이 정보와 게시물은 TradingView에서 제공하거나 보증하는 금융, 투자, 거래 또는 기타 유형의 조언이나 권고 사항을 의미하거나 구성하지 않습니다. 자세한 내용은 이용 약관을 참고하세요.