PROTECTED SOURCE SCRIPT
EMA 9 & 21 Crossover D-Line
📈 9 & 21 EMA Crossover – Trend Trading Made Simple
Description:
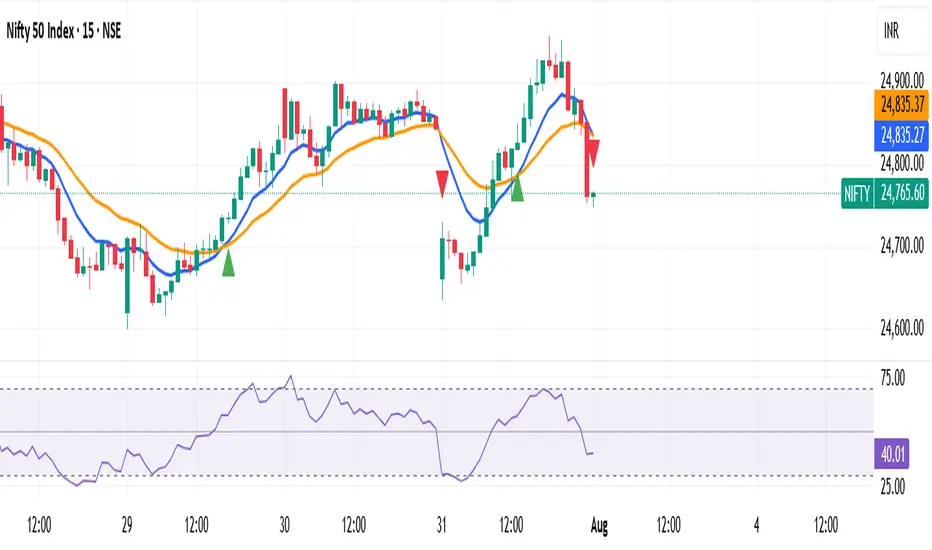
The 9 & 21 EMA Crossover indicator is a simple yet powerful trend-following tool designed for traders of all levels. This script plots two widely used exponential moving averages — a fast 9 EMA and a slower 21 EMA — directly on your chart.
When the 9 EMA crosses above the 21 EMA, it signals a potential bullish trend — perfect for spotting early entries in uptrends. Conversely, when the 9 EMA crosses below the 21 EMA, it indicates a possible bearish trend — ideal for identifying exit points or short opportunities.
Key Features:
✅ Clean and clear crossover signals marked with triangles
✅ Customizable visual settings for easy trend spotting
✅ Works on all timeframes and markets (stocks, forex, crypto, commodities)
✅ Suitable for intraday, swing, and position trading
This classic EMA crossover strategy is a favorite among trend traders for its simplicity and reliability. Combine it with your own confirmation tools or price action setups for even stronger results.
How to Use:
Look for a bullish crossover for potential buy setups.
Look for a bearish crossover for potential sell setups.
Use in conjunction with other technical tools for best results.
Disclaimer: This indicator is for educational purposes only. Always do your own research and practice good risk management before live trading.
Happy Trading! 📊✨
Description:
The 9 & 21 EMA Crossover indicator is a simple yet powerful trend-following tool designed for traders of all levels. This script plots two widely used exponential moving averages — a fast 9 EMA and a slower 21 EMA — directly on your chart.
When the 9 EMA crosses above the 21 EMA, it signals a potential bullish trend — perfect for spotting early entries in uptrends. Conversely, when the 9 EMA crosses below the 21 EMA, it indicates a possible bearish trend — ideal for identifying exit points or short opportunities.
Key Features:
✅ Clean and clear crossover signals marked with triangles
✅ Customizable visual settings for easy trend spotting
✅ Works on all timeframes and markets (stocks, forex, crypto, commodities)
✅ Suitable for intraday, swing, and position trading
This classic EMA crossover strategy is a favorite among trend traders for its simplicity and reliability. Combine it with your own confirmation tools or price action setups for even stronger results.
How to Use:
Look for a bullish crossover for potential buy setups.
Look for a bearish crossover for potential sell setups.
Use in conjunction with other technical tools for best results.
Disclaimer: This indicator is for educational purposes only. Always do your own research and practice good risk management before live trading.
Happy Trading! 📊✨
보호된 스크립트입니다
이 스크립트는 비공개 소스로 게시됩니다. 하지만 제한 없이 자유롭게 사용할 수 있습니다 — 여기에서 자세히 알아보기.
면책사항
이 정보와 게시물은 TradingView에서 제공하거나 보증하는 금융, 투자, 거래 또는 기타 유형의 조언이나 권고 사항을 의미하거나 구성하지 않습니다. 자세한 내용은 이용 약관을 참고하세요.
보호된 스크립트입니다
이 스크립트는 비공개 소스로 게시됩니다. 하지만 제한 없이 자유롭게 사용할 수 있습니다 — 여기에서 자세히 알아보기.
면책사항
이 정보와 게시물은 TradingView에서 제공하거나 보증하는 금융, 투자, 거래 또는 기타 유형의 조언이나 권고 사항을 의미하거나 구성하지 않습니다. 자세한 내용은 이용 약관을 참고하세요.