OPEN-SOURCE SCRIPT
HTF 6H Visualiser for 30M - ADK - W
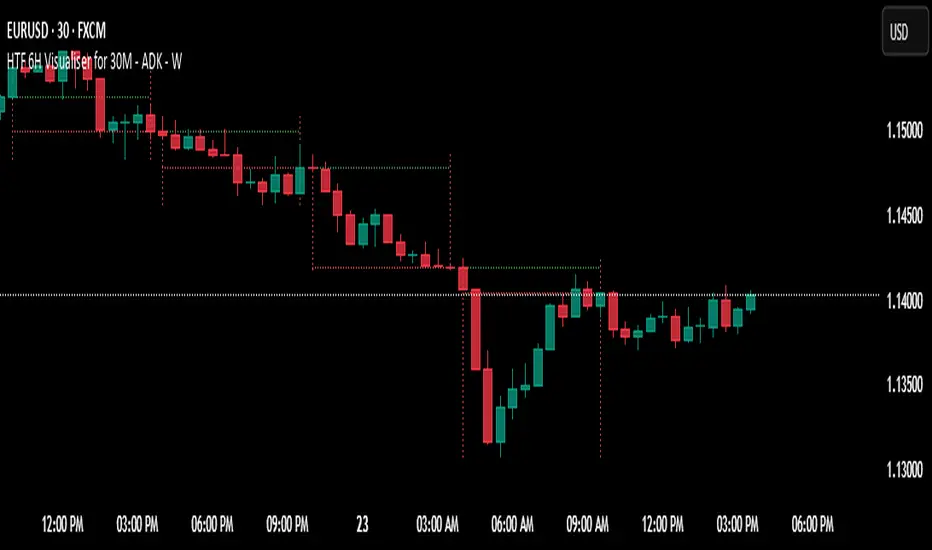
HTF 6H Visualiser — use on 30-minute charts
Purpose – lets 30-minute traders see the prior 6-hour candle’s range, open and close without changing time-frames.
Visual elements
Two dotted vertical lines mark the 6-hour candle’s start and an “early” finish one 30-min bar before the true close (avoids overlap).
Vertical colour: green for bullish 6 H close, red for bearish.
Dotted green horizontal at the 6 H open, red horizontal at the 6 H close – both drawn only between the two verticals.
Verticals are clipped to that candle’s exact high and low.
Data window – auto-deletes oldest guides so only ~2 trading days (8 candles) remain on the chart.
Typical uses – mean-reversion to 6 H opens/closes, quick HTF bias check, liquidity-grab targets.
오픈 소스 스크립트
트레이딩뷰의 진정한 정신에 따라, 이 스크립트의 작성자는 이를 오픈소스로 공개하여 트레이더들이 기능을 검토하고 검증할 수 있도록 했습니다. 작성자에게 찬사를 보냅니다! 이 코드는 무료로 사용할 수 있지만, 코드를 재게시하는 경우 하우스 룰이 적용된다는 점을 기억하세요.
면책사항
해당 정보와 게시물은 금융, 투자, 트레이딩 또는 기타 유형의 조언이나 권장 사항으로 간주되지 않으며, 트레이딩뷰에서 제공하거나 보증하는 것이 아닙니다. 자세한 내용은 이용 약관을 참조하세요.
오픈 소스 스크립트
트레이딩뷰의 진정한 정신에 따라, 이 스크립트의 작성자는 이를 오픈소스로 공개하여 트레이더들이 기능을 검토하고 검증할 수 있도록 했습니다. 작성자에게 찬사를 보냅니다! 이 코드는 무료로 사용할 수 있지만, 코드를 재게시하는 경우 하우스 룰이 적용된다는 점을 기억하세요.
면책사항
해당 정보와 게시물은 금융, 투자, 트레이딩 또는 기타 유형의 조언이나 권장 사항으로 간주되지 않으며, 트레이딩뷰에서 제공하거나 보증하는 것이 아닙니다. 자세한 내용은 이용 약관을 참조하세요.