OPEN-SOURCE SCRIPT
ANIL's OHCL, VWAP and EMA Cross
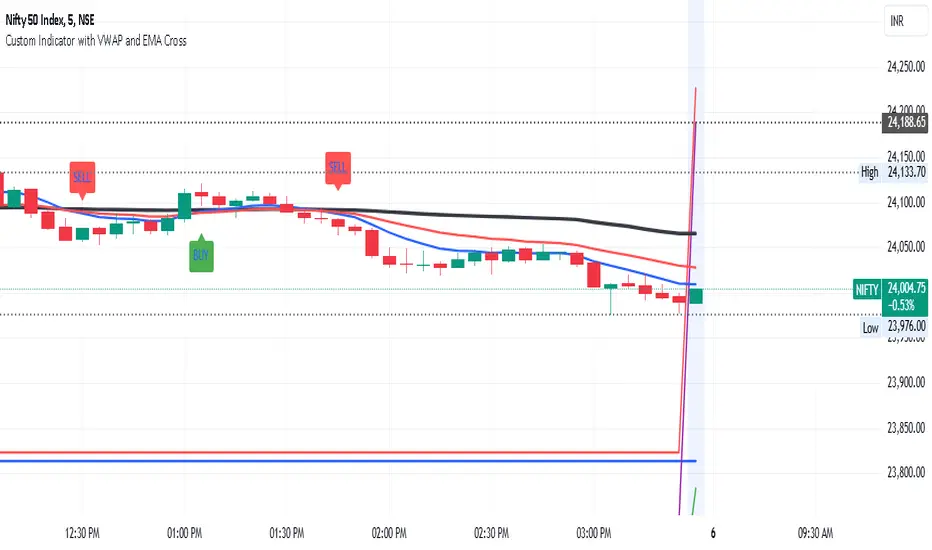
Previous Week High and Low:
This part calculates the previous week's high and low values and plots them as continuous blue lines. The plot.style_line ensures the lines are drawn continuously.
Previous Day Open, High, Low, Close:
The script uses request.security to get the previous day's open, high, low, and close values. These are plotted as continuous lines in different colors:
Open: Green
High: Red
Low: Orange
Close: Purple
VWAP (Volume Weighted Average Price):
The VWAP is calculated using ta.vwap(close) and plotted with a thick black line.
Exponential Moving Averages (EMAs):
The script calculates two EMAs: one with a 9-period (fast) and one with a 21-period (slow).
The EMAs are plotted as continuous lines:
Fast EMA: Blue
Slow EMA: Red
EMA Cross:
The script checks for EMA crossovers and crossunders:
A crossover (fast EMA crossing above slow EMA) triggers a buy signal (green label below the bar).
A crossunder (fast EMA crossing below slow EMA) triggers a sell signal (red label above the bar).
Customization:
You can adjust the fastLength and slowLength variables to change the period of the EMAs.
You can modify the line colors and line thickness to match your preferred style.
The buy and sell signals can be customized further with different shapes or additional conditions for signal generation.
This script provides a comprehensive and visually distinct indicator with the previous week's and day's levels, VWAP, and EMA crossover signals.
오픈 소스 스크립트
트레이딩뷰의 진정한 정신에 따라, 이 스크립트의 작성자는 이를 오픈소스로 공개하여 트레이더들이 기능을 검토하고 검증할 수 있도록 했습니다. 작성자에게 찬사를 보냅니다! 이 코드는 무료로 사용할 수 있지만, 코드를 재게시하는 경우 하우스 룰이 적용된다는 점을 기억하세요.
면책사항
해당 정보와 게시물은 금융, 투자, 트레이딩 또는 기타 유형의 조언이나 권장 사항으로 간주되지 않으며, 트레이딩뷰에서 제공하거나 보증하는 것이 아닙니다. 자세한 내용은 이용 약관을 참조하세요.
오픈 소스 스크립트
트레이딩뷰의 진정한 정신에 따라, 이 스크립트의 작성자는 이를 오픈소스로 공개하여 트레이더들이 기능을 검토하고 검증할 수 있도록 했습니다. 작성자에게 찬사를 보냅니다! 이 코드는 무료로 사용할 수 있지만, 코드를 재게시하는 경우 하우스 룰이 적용된다는 점을 기억하세요.
면책사항
해당 정보와 게시물은 금융, 투자, 트레이딩 또는 기타 유형의 조언이나 권장 사항으로 간주되지 않으며, 트레이딩뷰에서 제공하거나 보증하는 것이 아닙니다. 자세한 내용은 이용 약관을 참조하세요.