OPEN-SOURCE SCRIPT
업데이트됨 majikal78
Custom Volume Ratio Indicator
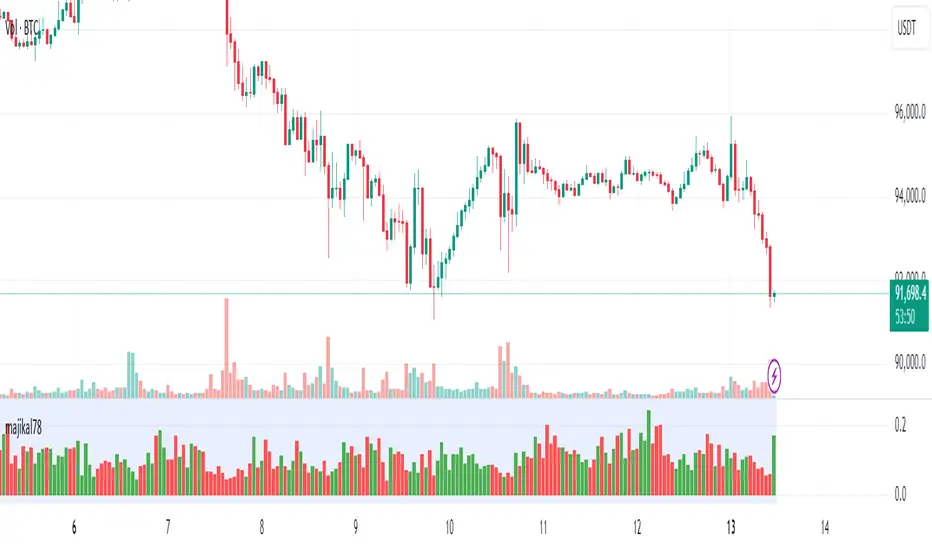
The Custom Volume Ratio Indicator is a unique tool designed for traders to analyze price movements in relation to trading volume. This indicator calculates the ratio of the price range (the difference between the highest and lowest prices of a candle) to the volume of that candle. By visualizing this ratio, traders can gain insights into market dynamics and potential price movements.
Key Features:
1. Price Range Calculation: The indicator computes the price range for each candle by subtracting the lowest price from the highest price. This gives traders an understanding of how much price fluctuated during that specific time frame.
2. Volume Measurement: It utilizes the trading volume of each candle, which reflects the number of shares or contracts traded during that period. Volume is a critical factor in confirming trends and reversals in the market.
3. Ratio Visualization: The primary output of the indicator is the ratio of price range to volume. A higher ratio may indicate increased volatility relative to volume, suggesting potential trading opportunities. Conversely, a lower ratio could imply a more stable market environment.
4. Color-Coded Bars: The bars representing the ratio are color-coded based on the candle's closing price relative to its opening price. Green bars indicate bullish candles (where the close is higher than the open), while red bars indicate bearish candles (where the close is lower than the open). This visual cue helps traders quickly assess market sentiment.
5. Background Highlighting: The indicator also features a subtle background color to enhance visibility, making it easier for traders to focus on key areas of interest on the chart.
Use Cases:
• Trend Confirmation: Traders can use the volume ratio to confirm existing trends. A rising ratio alongside increasing volume may suggest a strong bullish trend, while a declining ratio could indicate weakening momentum.
• Volatility Assessment: By analyzing the price range relative to volume, traders can identify periods of high volatility. This information can be crucial for setting stop-loss orders or determining entry points.
• Market Sentiment Analysis: The color-coded bars provide immediate insight into market sentiment, allowing traders to make informed decisions based on recent price action.
Overall, the Custom Volume Ratio Indicator serves as a valuable addition to any trader's toolkit, providing essential insights into market behavior and helping to inform trading strategies.
릴리즈 노트
Custom Volume Ratio Indicator
The Custom Volume Ratio Indicator is a unique tool designed for traders to analyze price movements in relation to trading volume. This indicator calculates the ratio of the price range (the difference between the highest and lowest prices of a candle) to the volume of that candle. By visualizing this ratio, traders can gain insights into market dynamics and potential price movements.
Key Features:
1. Price Range Calculation: The indicator computes the price range for each candle by subtracting the lowest price from the highest price. This gives traders an understanding of how much price fluctuated during that specific time frame.
2. Volume Measurement: It utilizes the trading volume of each candle, which reflects the number of shares or contracts traded during that period. Volume is a critical factor in confirming trends and reversals in the market.
3. Ratio Visualization: The primary output of the indicator is the ratio of price range to volume. A higher ratio may indicate increased volatility relative to volume, suggesting potential trading opportunities. Conversely, a lower ratio could imply a more stable market environment.
4. Color-Coded Bars: The bars representing the ratio are color-coded based on the candle's closing price relative to its opening price. Green bars indicate bullish candles (where the close is higher than the open), while red bars indicate bearish candles (where the close is lower than the open). This visual cue helps traders quickly assess market sentiment.
5. Background Highlighting: The indicator also features a subtle background color to enhance visibility, making it easier for traders to focus on key areas of interest on the chart.
Use Cases:
• Trend Confirmation: Traders can use the volume ratio to confirm existing trends. A rising ratio alongside increasing volume may suggest a strong bullish trend, while a declining ratio could indicate weakening momentum.
• Volatility Assessment: By analyzing the price range relative to volume, traders can identify periods of high volatility. This information can be crucial for setting stop-loss orders or determining entry points.
• Market Sentiment Analysis: The color-coded bars provide immediate insight into market sentiment, allowing traders to make informed decisions based on recent price action.
Overall, the Custom Volume Ratio Indicator serves as a valuable addition to any trader's toolkit, providing essential insights into market behavior and helping to inform trading strategies.
오픈 소스 스크립트
트레이딩뷰의 진정한 정신에 따라, 이 스크립트의 작성자는 이를 오픈소스로 공개하여 트레이더들이 기능을 검토하고 검증할 수 있도록 했습니다. 작성자에게 찬사를 보냅니다! 이 코드는 무료로 사용할 수 있지만, 코드를 재게시하는 경우 하우스 룰이 적용된다는 점을 기억하세요.
면책사항
해당 정보와 게시물은 금융, 투자, 트레이딩 또는 기타 유형의 조언이나 권장 사항으로 간주되지 않으며, 트레이딩뷰에서 제공하거나 보증하는 것이 아닙니다. 자세한 내용은 이용 약관을 참조하세요.
오픈 소스 스크립트
트레이딩뷰의 진정한 정신에 따라, 이 스크립트의 작성자는 이를 오픈소스로 공개하여 트레이더들이 기능을 검토하고 검증할 수 있도록 했습니다. 작성자에게 찬사를 보냅니다! 이 코드는 무료로 사용할 수 있지만, 코드를 재게시하는 경우 하우스 룰이 적용된다는 점을 기억하세요.
면책사항
해당 정보와 게시물은 금융, 투자, 트레이딩 또는 기타 유형의 조언이나 권장 사항으로 간주되지 않으며, 트레이딩뷰에서 제공하거나 보증하는 것이 아닙니다. 자세한 내용은 이용 약관을 참조하세요.