OPEN-SOURCE SCRIPT
MTFHTS with Moving Average Ribbon and Buy/Sell Signals 3.2
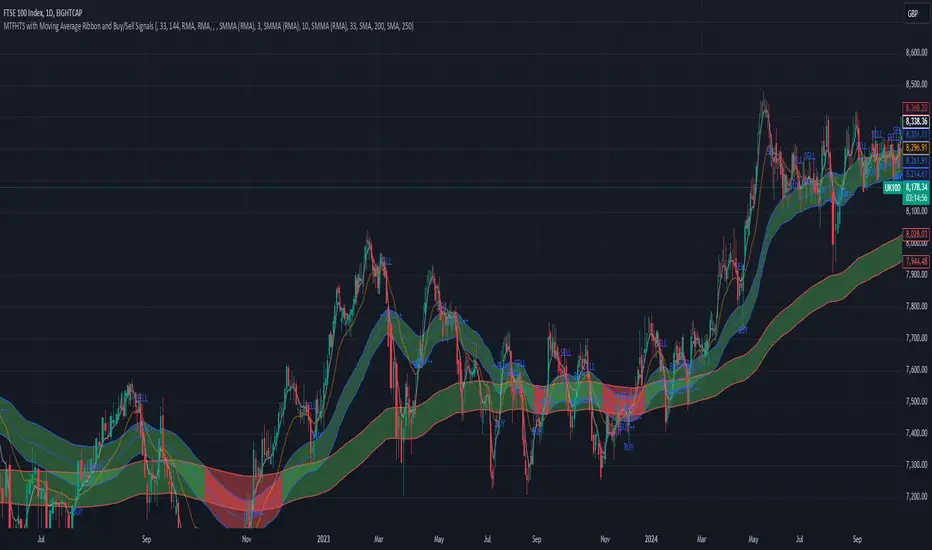
Multi-Timeframe Moving Average Strategy with Buy and Sell Signals
Purpose
This strategy is designed to provide clear, data-driven buy and sell signals based on moving average crossovers across multiple timeframes. It aims to help traders identify potential trend reversals and entry/exit points using a systematic approach.
How it Works
Moving Averages Across Multiple Timeframes:
Five customizable moving averages (MA №1 to MA №5) are calculated using different lengths and types, including SMA, EMA, WMA, and VWMA, to suit various trading styles.
The MAs are plotted on different timeframes, allowing traders to visualize trend alignment and identify market momentum across short, medium, and long terms.
Signals for Buying and Selling:
Buy Signals: When the shorter-term MA (MA №1) crosses above a longer-term MA (MA №2 or MA №3), the strategy triggers a buy signal, indicating potential upward momentum.
Sell Signals: When MA №1 crosses below a longer-term MA (MA №2 or MA №3), a sell signal is triggered, suggesting potential downward movement.
Visual Aids and Alerts:
The strategy uses color fills between MAs to indicate bullish (green) or bearish (red) trends, helping traders assess market conditions at a glance.
Alerts for buy and sell signals keep traders notified in real-time, helping to avoid missed opportunities.
Important Note
This strategy is purely educational and does not constitute investment advice. It serves as a tool to help traders understand how multi-timeframe moving averages and crossovers can be used in technical analysis. As with any trading strategy, we recommend testing in a simulated environment and exercising caution.
오픈 소스 스크립트
진정한 트레이딩뷰 정신에 따라 이 스크립트 작성자는 트레이더가 기능을 검토하고 검증할 수 있도록 오픈소스로 공개했습니다. 작성자에게 찬사를 보냅니다! 무료로 사용할 수 있지만 코드를 다시 게시할 경우 하우스 룰이 적용된다는 점을 기억하세요.
면책사항
이 정보와 게시물은 TradingView에서 제공하거나 보증하는 금융, 투자, 거래 또는 기타 유형의 조언이나 권고 사항을 의미하거나 구성하지 않습니다. 자세한 내용은 이용 약관을 참고하세요.
오픈 소스 스크립트
진정한 트레이딩뷰 정신에 따라 이 스크립트 작성자는 트레이더가 기능을 검토하고 검증할 수 있도록 오픈소스로 공개했습니다. 작성자에게 찬사를 보냅니다! 무료로 사용할 수 있지만 코드를 다시 게시할 경우 하우스 룰이 적용된다는 점을 기억하세요.
면책사항
이 정보와 게시물은 TradingView에서 제공하거나 보증하는 금융, 투자, 거래 또는 기타 유형의 조언이나 권고 사항을 의미하거나 구성하지 않습니다. 자세한 내용은 이용 약관을 참고하세요.