OPEN-SOURCE SCRIPT
G-RSI&EMA channel v.1
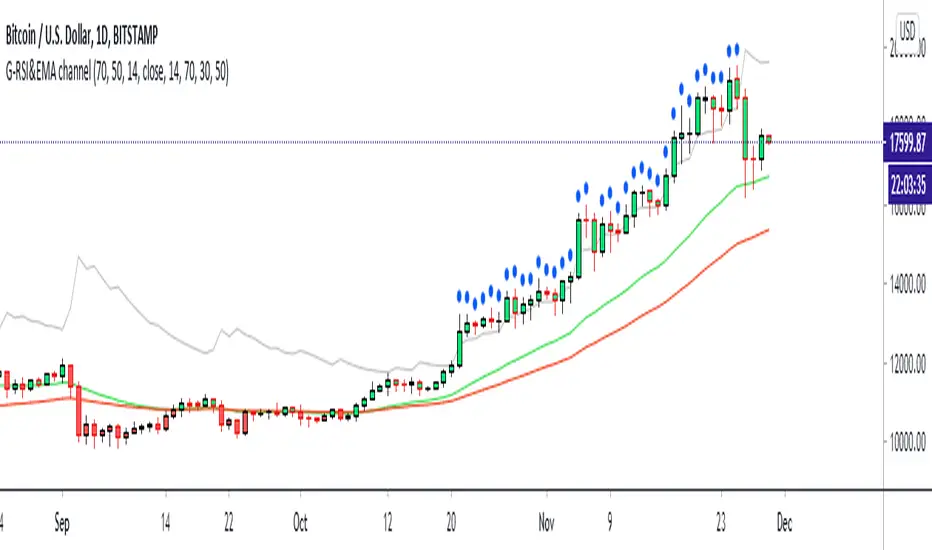
This my 2nd indicator : It's just a Strenghtening of trend channal
If price can come up on the green line it's mean price is side way or maybe bullish
and if price can come up on RSI (14)50 and EMA50 it have problaby to bullish trend
If the price have blue ball it's mean crazy strong bullish trend
If the price have red ball it's mean crazy strong bearish trend
you can use my 1st script together : 1st is " G-Bollingerbands Volatility breakout "
My 1st script detect the price begin to have volatility
My 2nd scrit detect the trend
Goodluck :D
PS: My 2nd script develop from someone in tradingview RSI script i'm sorry I can't remember but thank you very much.
오픈 소스 스크립트
트레이딩뷰의 진정한 정신에 따라, 이 스크립트의 작성자는 이를 오픈소스로 공개하여 트레이더들이 기능을 검토하고 검증할 수 있도록 했습니다. 작성자에게 찬사를 보냅니다! 이 코드는 무료로 사용할 수 있지만, 코드를 재게시하는 경우 하우스 룰이 적용된다는 점을 기억하세요.
면책사항
해당 정보와 게시물은 금융, 투자, 트레이딩 또는 기타 유형의 조언이나 권장 사항으로 간주되지 않으며, 트레이딩뷰에서 제공하거나 보증하는 것이 아닙니다. 자세한 내용은 이용 약관을 참조하세요.
오픈 소스 스크립트
트레이딩뷰의 진정한 정신에 따라, 이 스크립트의 작성자는 이를 오픈소스로 공개하여 트레이더들이 기능을 검토하고 검증할 수 있도록 했습니다. 작성자에게 찬사를 보냅니다! 이 코드는 무료로 사용할 수 있지만, 코드를 재게시하는 경우 하우스 룰이 적용된다는 점을 기억하세요.
면책사항
해당 정보와 게시물은 금융, 투자, 트레이딩 또는 기타 유형의 조언이나 권장 사항으로 간주되지 않으며, 트레이딩뷰에서 제공하거나 보증하는 것이 아닙니다. 자세한 내용은 이용 약관을 참조하세요.