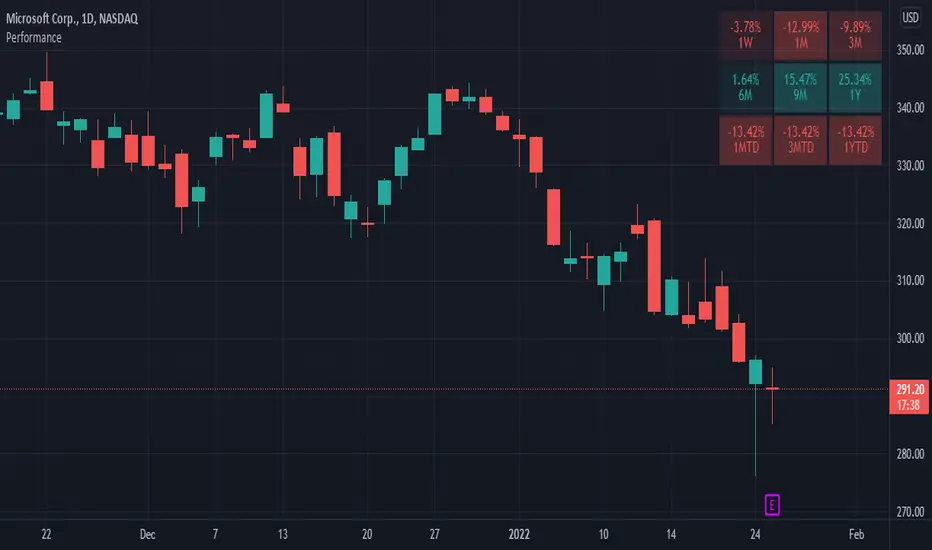
This indicator is based on the Performance section in the TradingView's sidebar and uses new Pine tables functionality. It compares the current price of the symbol to its past price and calculates the rate of return to make it easier to track the performance of the symbol. Note that the Performance sidebar is not updated in real-time, while this indicator is, so on real-time charts the values between the two can differ (the indicator's values are more recent).
The formula of the calculation is (Current value - Past value) * 100 / Past value, where Past value is:
The formula of the calculation is (Current value - Past value) * 100 / Past value, where Past value is:
- 1W - close 5 daily bars ago
- 1M - close 21 daily bars ago
- 3M - close 63 daily bars ago
- 6M - close 126 daily bars ago
- YTD - close of the past year
- 1Y - close 251 daily bars ago
릴리즈 노트
Made a number of functional improvements:- Changed the calculation algorithm to fit what TV is using right now. It works better on all types of charts, including crypto, unlike the previous one, that was tied to the number of working days.
- Added customizable timeframes. It is now possible to set up to 6 different 'Absolute' timeframes and up to 3 'To Date' ones (intraday timeframes are not supported). New timeframes can be added via the chart's Timeframe dropdown - add the custom timeframe there and it will also appear in the indicator's settings. Note that not added timeframes show up as "Chart" until you add them.
- Added an option to customize the width of the table. The height will adjust automatically.
- Converted to Pine v5.
P.S. Let me know if you encounter any issues with the new version.
오픈 소스 스크립트
트레이딩뷰의 진정한 정신에 따라, 이 스크립트의 작성자는 이를 오픈소스로 공개하여 트레이더들이 기능을 검토하고 검증할 수 있도록 했습니다. 작성자에게 찬사를 보냅니다! 이 코드는 무료로 사용할 수 있지만, 코드를 재게시하는 경우 하우스 룰이 적용된다는 점을 기억하세요.
면책사항
해당 정보와 게시물은 금융, 투자, 트레이딩 또는 기타 유형의 조언이나 권장 사항으로 간주되지 않으며, 트레이딩뷰에서 제공하거나 보증하는 것이 아닙니다. 자세한 내용은 이용 약관을 참조하세요.
오픈 소스 스크립트
트레이딩뷰의 진정한 정신에 따라, 이 스크립트의 작성자는 이를 오픈소스로 공개하여 트레이더들이 기능을 검토하고 검증할 수 있도록 했습니다. 작성자에게 찬사를 보냅니다! 이 코드는 무료로 사용할 수 있지만, 코드를 재게시하는 경우 하우스 룰이 적용된다는 점을 기억하세요.
면책사항
해당 정보와 게시물은 금융, 투자, 트레이딩 또는 기타 유형의 조언이나 권장 사항으로 간주되지 않으며, 트레이딩뷰에서 제공하거나 보증하는 것이 아닙니다. 자세한 내용은 이용 약관을 참조하세요.
