OPEN-SOURCE SCRIPT
DDDDD: SET50 (40 Stocks) - % New 52W Lows
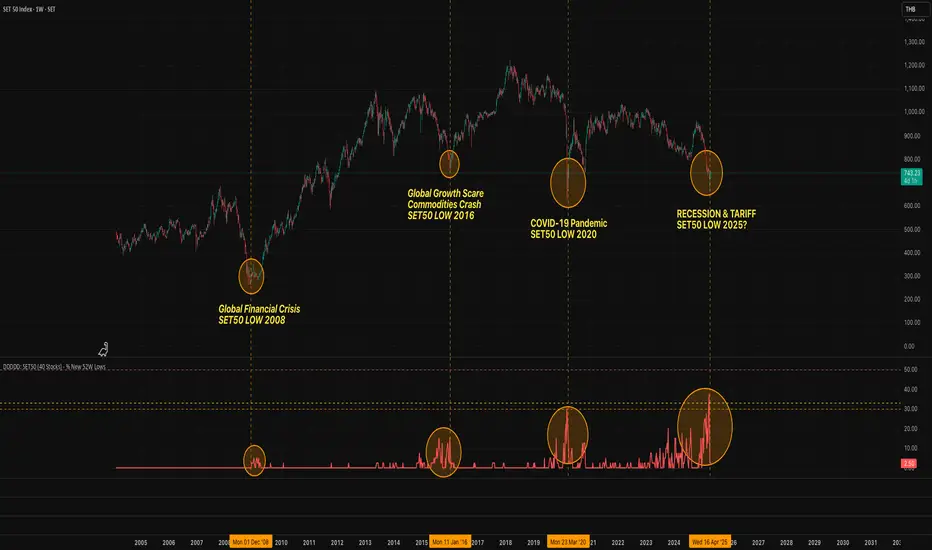
DDDDD: SET50 - % New 52W Lows (40 Stocks)
This indicator measures the percentage of selected SET50 stocks making a new 52-week low, helping identify periods of extreme market fear that often align with long-term buying opportunities.
How It Works:
Tracks the daily closing prices of 40 major SET50 constituents.
A stock is counted when it closes at its lowest price over the past 252 trading days (approximately 1 year).
Calculates the percentage of new 52-week lows relative to 40 stocks.
Displays threshold lines to highlight levels of market panic.
📈 Threshold Levels:
Threshold Line Color Level (%) Interpretation Action
30% Threshold Orange 30% Early signs of stress Start monitoring opportunities
33% Threshold Yellow 33% Confirmed panic Consider gradual accumulation
50% Panic Zone Red 50% Extreme market panic Aggressive accumulation zone
📌 Important Notes:
Why not use the full 50 stocks?
Due to TradingView Pine Script's current technical limits, a script cannot request data for more than 40 symbols efficiently.
Therefore, this indicator uses 40 representative SET50 stocks to ensure optimal performance without exceeding system limits.
The selected stocks are diversified across major sectors to maintain reliability.
🔥 Key Insights:
Historically, spikes above 30%-50% of stocks making new lows have coincided with major market bottoms (e.g., 2011, 2020).
Higher simultaneous new lows = stronger potential for long-term recovery.
오픈 소스 스크립트
트레이딩뷰의 진정한 정신에 따라, 이 스크립트의 작성자는 이를 오픈소스로 공개하여 트레이더들이 기능을 검토하고 검증할 수 있도록 했습니다. 작성자에게 찬사를 보냅니다! 이 코드는 무료로 사용할 수 있지만, 코드를 재게시하는 경우 하우스 룰이 적용된다는 점을 기억하세요.
면책사항
해당 정보와 게시물은 금융, 투자, 트레이딩 또는 기타 유형의 조언이나 권장 사항으로 간주되지 않으며, 트레이딩뷰에서 제공하거나 보증하는 것이 아닙니다. 자세한 내용은 이용 약관을 참조하세요.
오픈 소스 스크립트
트레이딩뷰의 진정한 정신에 따라, 이 스크립트의 작성자는 이를 오픈소스로 공개하여 트레이더들이 기능을 검토하고 검증할 수 있도록 했습니다. 작성자에게 찬사를 보냅니다! 이 코드는 무료로 사용할 수 있지만, 코드를 재게시하는 경우 하우스 룰이 적용된다는 점을 기억하세요.
면책사항
해당 정보와 게시물은 금융, 투자, 트레이딩 또는 기타 유형의 조언이나 권장 사항으로 간주되지 않으며, 트레이딩뷰에서 제공하거나 보증하는 것이 아닙니다. 자세한 내용은 이용 약관을 참조하세요.