OPEN-SOURCE SCRIPT
업데이트됨 Roger & Satchell Estimator Historical Volatility Bands [Loxx]
Roger & Satchell Estimator Historical Volatility Bands [Loxx] are constructed using:
What is Roger & Satchell Estimator Historical Volatility?
The Rogers–Satchell estimator does not handle opening jumps; therefore, it underestimates the volatility. It accurately explains the volatility portion that can be attributed entirely to a trend in the price evolution. Rogers and Satchell try to embody the frequency of price observations in the model in order to overcome the drawback. They claim that the corrected estimator outperforms the uncorrected one in a study based on simulated data.
RSEHV = sqrt((Z/n) * sum((log(high/close)*log(high/open)) + (log(low/close)*log(low/open))))
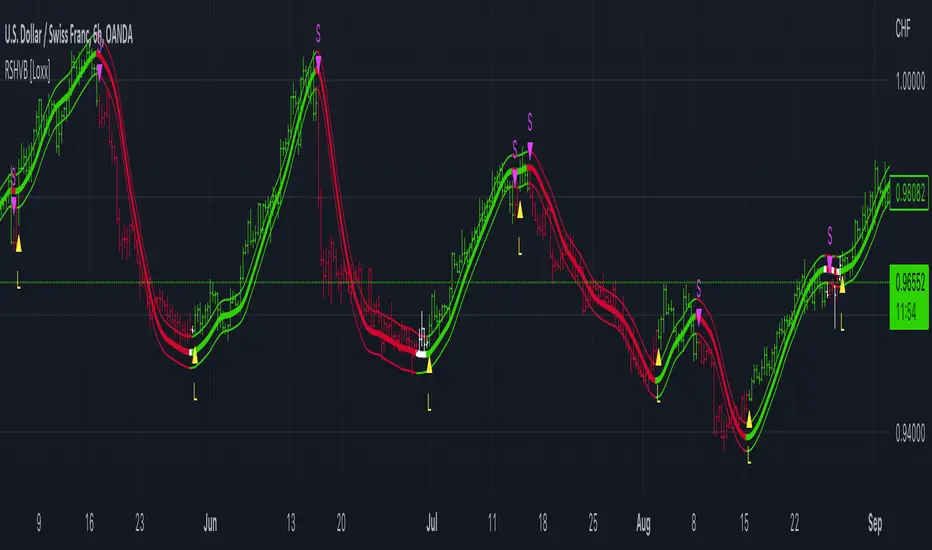
The color of the middle line, unlike the bands colors, has 3 colors. When colors of the bands are the same, then the middle line has the same color, otherwise it's white.
Included
- Average as the middle line.
- Upper and lower bands using theRoger & Satchell Estimator Historical Volatility Bands for bands calculation.
What is Roger & Satchell Estimator Historical Volatility?
The Rogers–Satchell estimator does not handle opening jumps; therefore, it underestimates the volatility. It accurately explains the volatility portion that can be attributed entirely to a trend in the price evolution. Rogers and Satchell try to embody the frequency of price observations in the model in order to overcome the drawback. They claim that the corrected estimator outperforms the uncorrected one in a study based on simulated data.
RSEHV = sqrt((Z/n) * sum((log(high/close)*log(high/open)) + (log(low/close)*log(low/open))))
The color of the middle line, unlike the bands colors, has 3 colors. When colors of the bands are the same, then the middle line has the same color, otherwise it's white.
Included
- Alerts
- Signals
- Loxx's Expanded Source Types
- Bar coloring
릴리즈 노트
Updated to handle all timeframes. This calculation is without annualized modification so that it's relevant to the current timeframe only.오픈 소스 스크립트
트레이딩뷰의 진정한 정신에 따라, 이 스크립트의 작성자는 이를 오픈소스로 공개하여 트레이더들이 기능을 검토하고 검증할 수 있도록 했습니다. 작성자에게 찬사를 보냅니다! 이 코드는 무료로 사용할 수 있지만, 코드를 재게시하는 경우 하우스 룰이 적용된다는 점을 기억하세요.
Public Telegram Group, t.me/algxtrading_public
VIP Membership Info: patreon.com/algxtrading/membership
VIP Membership Info: patreon.com/algxtrading/membership
면책사항
해당 정보와 게시물은 금융, 투자, 트레이딩 또는 기타 유형의 조언이나 권장 사항으로 간주되지 않으며, 트레이딩뷰에서 제공하거나 보증하는 것이 아닙니다. 자세한 내용은 이용 약관을 참조하세요.
오픈 소스 스크립트
트레이딩뷰의 진정한 정신에 따라, 이 스크립트의 작성자는 이를 오픈소스로 공개하여 트레이더들이 기능을 검토하고 검증할 수 있도록 했습니다. 작성자에게 찬사를 보냅니다! 이 코드는 무료로 사용할 수 있지만, 코드를 재게시하는 경우 하우스 룰이 적용된다는 점을 기억하세요.
Public Telegram Group, t.me/algxtrading_public
VIP Membership Info: patreon.com/algxtrading/membership
VIP Membership Info: patreon.com/algxtrading/membership
면책사항
해당 정보와 게시물은 금융, 투자, 트레이딩 또는 기타 유형의 조언이나 권장 사항으로 간주되지 않으며, 트레이딩뷰에서 제공하거나 보증하는 것이 아닙니다. 자세한 내용은 이용 약관을 참조하세요.