OPEN-SOURCE SCRIPT
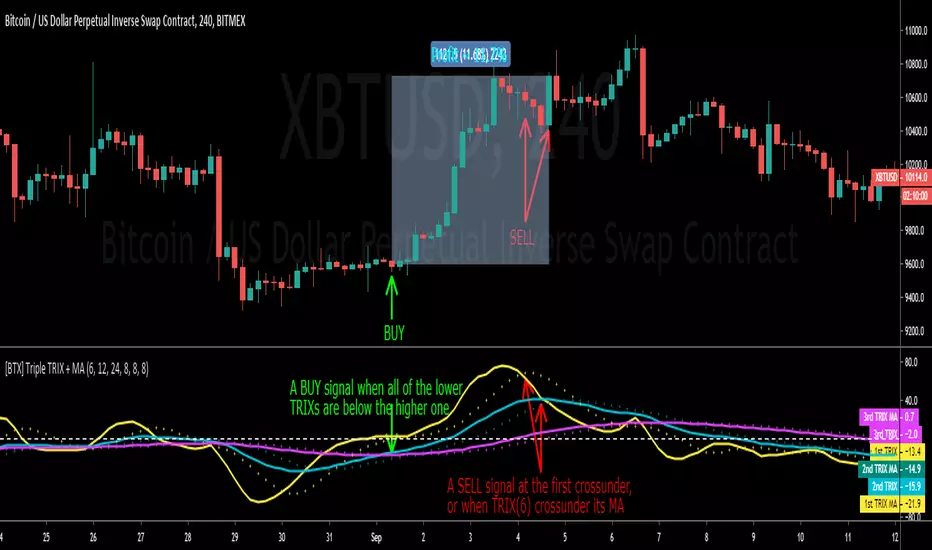
[BTX] Triple TRIX + MAs
This indicator suggest a strategy, which is quite similar to multiple MA or multiple RSI strategies.
This indicator can be used for all timeframes, all markets.
This indicator can help detect the market trend and momentum.
Default values are TRIX - 6, 12, and 24 periods and MA(8) for each TRIX line. You can choose what type of MA to be used (EMA or SMA).
How to exploit this indicator?
- When all of the lower TRIXs are ABOVE the higher one: TRIX(6) is above TRIX(12), and TRIX(12) is above TRIX(24), there is a BULLISH market.
- When all of the lower TRIXs are BELOW the higher one: TRIX(6) is below TRIX(12), and TRIX(12) is below TRIX(24), there is a BEARISH market.
- A crossover of the lower TRIX to the higher one indicates a BUY signal.
- A crossunder of the lower TRIX to the higher one indicates a SELL signal.
- TRIX crossover the Zero line can be considered as a STRONG bullish signal.
- TRIX crossunder the Zero line can be considered as a STRONG bearish signal.
- The MA of TRIX acts as a confirmation, it can be used as SELL signals.
- High slopes of TRIX lines can point out the high momentum of the current trend.
- Divergence patterns can be used with this indicator.
- And many more tricks.
오픈 소스 스크립트
트레이딩뷰의 진정한 정신에 따라, 이 스크립트의 작성자는 이를 오픈소스로 공개하여 트레이더들이 기능을 검토하고 검증할 수 있도록 했습니다. 작성자에게 찬사를 보냅니다! 이 코드는 무료로 사용할 수 있지만, 코드를 재게시하는 경우 하우스 룰이 적용된다는 점을 기억하세요.
면책사항
해당 정보와 게시물은 금융, 투자, 트레이딩 또는 기타 유형의 조언이나 권장 사항으로 간주되지 않으며, 트레이딩뷰에서 제공하거나 보증하는 것이 아닙니다. 자세한 내용은 이용 약관을 참조하세요.
오픈 소스 스크립트
트레이딩뷰의 진정한 정신에 따라, 이 스크립트의 작성자는 이를 오픈소스로 공개하여 트레이더들이 기능을 검토하고 검증할 수 있도록 했습니다. 작성자에게 찬사를 보냅니다! 이 코드는 무료로 사용할 수 있지만, 코드를 재게시하는 경우 하우스 룰이 적용된다는 점을 기억하세요.
면책사항
해당 정보와 게시물은 금융, 투자, 트레이딩 또는 기타 유형의 조언이나 권장 사항으로 간주되지 않으며, 트레이딩뷰에서 제공하거나 보증하는 것이 아닙니다. 자세한 내용은 이용 약관을 참조하세요.