PROTECTED SOURCE SCRIPT
업데이트됨 GS_QuantEdge
GS_QuantEdge is a focused swing trading tool built for traders who seek tight entries and high risk-reward setups.
What it includes:
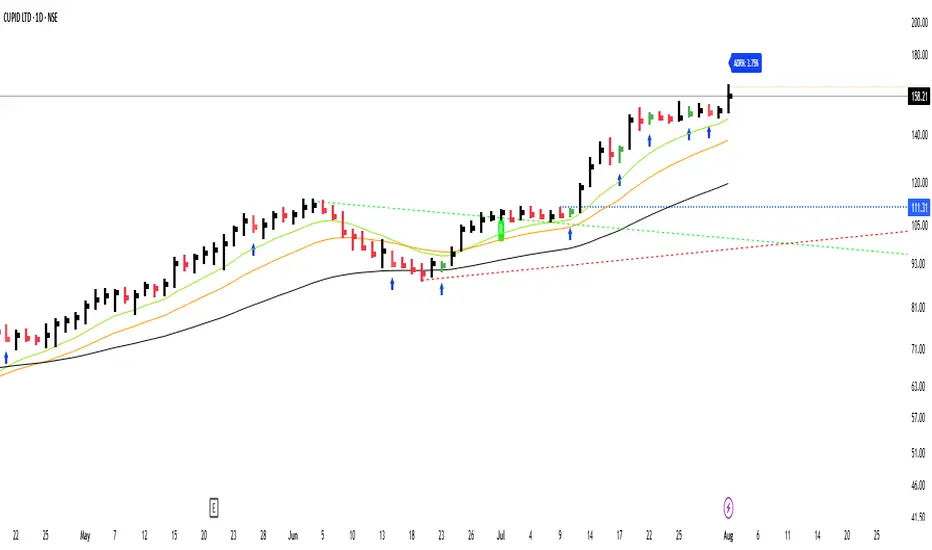
ATR-Based Trendlines:
Automatically plots dynamic upper and lower levels using pivots and ATR-based slope logic. Helps define key price zones where reactions or breakouts are likely.
Inside Bar Detection:
Identifies inside bar candles with subtle blue arrows below the bar and colors the candle — ideal for spotting low-risk compression setups before potential expansion.
ADR% Volatility Label:
Displays the Average Daily Range as a percentage of the current price, helping you assess volatility and optimize position sizing.
EMA Overlay (11, 21, 50):
Plots essential EMAs directly on the chart to observe trend structure and alignment, aiding in identifying high-probability trade zones.
High/Low Flags (hidden by default):
Marks new 11-bar, 21-bar highs and 52-bar lows to signal momentum or exhaustion. Helpful for observing if price is making new highs/lows on different timeframe scales.
How it helps:
This indicator gives swing traders a clean, structured chart view — highlighting areas of compression, breakout zones, and volatility conditions. Whether you're entering early on tight setups or waiting for confirmation, GS_QuantEdge helps you stay focused on well-defined opportunities with optimal risk-to-reward potential.
What it includes:
ATR-Based Trendlines:
Automatically plots dynamic upper and lower levels using pivots and ATR-based slope logic. Helps define key price zones where reactions or breakouts are likely.
Inside Bar Detection:
Identifies inside bar candles with subtle blue arrows below the bar and colors the candle — ideal for spotting low-risk compression setups before potential expansion.
ADR% Volatility Label:
Displays the Average Daily Range as a percentage of the current price, helping you assess volatility and optimize position sizing.
EMA Overlay (11, 21, 50):
Plots essential EMAs directly on the chart to observe trend structure and alignment, aiding in identifying high-probability trade zones.
High/Low Flags (hidden by default):
Marks new 11-bar, 21-bar highs and 52-bar lows to signal momentum or exhaustion. Helpful for observing if price is making new highs/lows on different timeframe scales.
How it helps:
This indicator gives swing traders a clean, structured chart view — highlighting areas of compression, breakout zones, and volatility conditions. Whether you're entering early on tight setups or waiting for confirmation, GS_QuantEdge helps you stay focused on well-defined opportunities with optimal risk-to-reward potential.
릴리즈 노트
alert conditions for inside bars were added. These alerts will now trigger when any inside bar is formed, or specifically when a bullish or bearish inside bar appears. This makes the indicator compatible with TradingView alerts and also useful in screener-style setups or automation workflows.보호된 스크립트입니다
이 스크립트는 비공개 소스로 게시됩니다. 하지만 이를 자유롭게 제한 없이 사용할 수 있습니다 – 자세한 내용은 여기에서 확인하세요.
면책사항
해당 정보와 게시물은 금융, 투자, 트레이딩 또는 기타 유형의 조언이나 권장 사항으로 간주되지 않으며, 트레이딩뷰에서 제공하거나 보증하는 것이 아닙니다. 자세한 내용은 이용 약관을 참조하세요.
보호된 스크립트입니다
이 스크립트는 비공개 소스로 게시됩니다. 하지만 이를 자유롭게 제한 없이 사용할 수 있습니다 – 자세한 내용은 여기에서 확인하세요.
면책사항
해당 정보와 게시물은 금융, 투자, 트레이딩 또는 기타 유형의 조언이나 권장 사항으로 간주되지 않으며, 트레이딩뷰에서 제공하거나 보증하는 것이 아닙니다. 자세한 내용은 이용 약관을 참조하세요.