OPEN-SOURCE SCRIPT
Signal
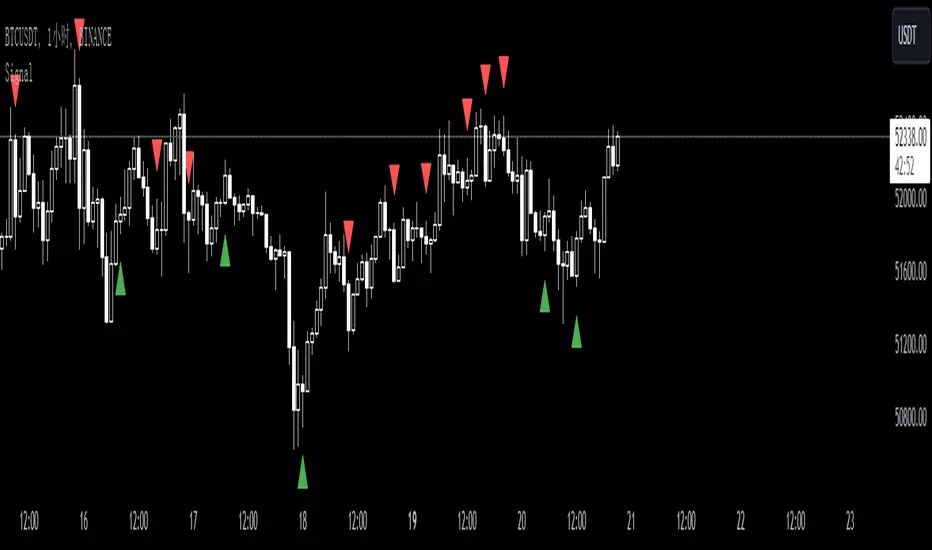
This custom TradingView indicator, named "Signal," is designed to generate buy and sell signals based on the Stochastic Oscillator, a momentum indicator that compares a particular closing price of an asset to a range of its prices over a certain period of time. The indicator is set to overlay on the price chart, providing visual cues for potential trading opportunities.
Key features of the "Signal" indicator include:
1. **Dynamic Period Adjustment**: The indicator automatically adjusts its settings based on the chart's time frame. For a 1-hour (60 minutes) chart, the stochastic length is set to 15, while for a 15-minute chart, the length is set to 10.
2. **Stochastic Calculation**: It calculates the %K line as a smoothed moving average (SMA) of the stochastic ratio, and the %D line as an SMA of the %K line, with both lines smoothed over a period derived from the dynamic length setting.
3. **Signal Detection**: The indicator identifies bullish crossovers (golden crosses) when the %K line crosses above the %D line and the average of both lines is below 50. Conversely, it detects bearish crossovers (death crosses) when the %K line crosses below the %D line and the average is above 50.
4. **Signal Confirmation**: Signals are confirmed using historical data with an offset of 1 bar to ensure that the crossover is evaluated after the close of the candlestick, thus avoiding repainting issues.
5. **Visual Indicators**: Buy signals are represented by green upward-pointing triangles placed below the bars, while sell signals are indicated by red downward-pointing triangles above the bars.
6. **Alerts**: The indicator includes alert conditions for both golden crosses and death crosses, notifying users when a potential buy or sell signal has been identified based on the stochastic crossover.
This indicator can be a valuable tool for traders who follow stochastic momentum signals and prefer to have dynamic adjustments based on the chart's time frame. It is important to note that, as with all trading indicators, the "Signal" indicator should be used in conjunction with other forms of analysis to confirm trading signals and manage risk effectively.
오픈 소스 스크립트
트레이딩뷰의 진정한 정신에 따라, 이 스크립트의 작성자는 이를 오픈소스로 공개하여 트레이더들이 기능을 검토하고 검증할 수 있도록 했습니다. 작성자에게 찬사를 보냅니다! 이 코드는 무료로 사용할 수 있지만, 코드를 재게시하는 경우 하우스 룰이 적용된다는 점을 기억하세요.
면책사항
해당 정보와 게시물은 금융, 투자, 트레이딩 또는 기타 유형의 조언이나 권장 사항으로 간주되지 않으며, 트레이딩뷰에서 제공하거나 보증하는 것이 아닙니다. 자세한 내용은 이용 약관을 참조하세요.
오픈 소스 스크립트
트레이딩뷰의 진정한 정신에 따라, 이 스크립트의 작성자는 이를 오픈소스로 공개하여 트레이더들이 기능을 검토하고 검증할 수 있도록 했습니다. 작성자에게 찬사를 보냅니다! 이 코드는 무료로 사용할 수 있지만, 코드를 재게시하는 경우 하우스 룰이 적용된다는 점을 기억하세요.
면책사항
해당 정보와 게시물은 금융, 투자, 트레이딩 또는 기타 유형의 조언이나 권장 사항으로 간주되지 않으며, 트레이딩뷰에서 제공하거나 보증하는 것이 아닙니다. 자세한 내용은 이용 약관을 참조하세요.