OPEN-SOURCE SCRIPT
Earnings Levels
I am proud to announce that the formerly secret "Key Earnings Levels" graphing tool will be freely available to TradingView users whereas before it was only available by monthly or annual subscription since its invention here at TradingView many years ago by Tim West. TradingView code writers wrote the original code for using this powerful tool and then Johannes Falkenburg re-wrote the code several years ago.
The most important FOUR days a year in a stock chart are the days that the company gives its quarterly update. Since the GRAND majority of companies have earnings, the indicator is called the "Key Earnings Level", or KEL for short. The unique part of the release of the quarterly update is that it can be "before the open" or "after the close" and the price action leading up to the earnings and immediately after the earnings are useful for future reference, as you'll see shortly.
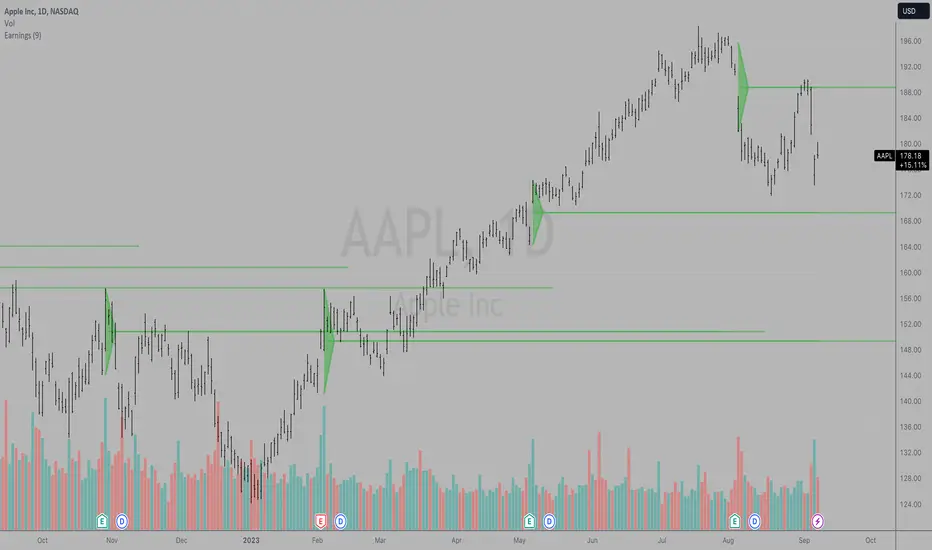
The Key Earnings indicator plots a triangle for the range around the day before and the day after earnings and draws a mid-point line to capture the over/under level for that report. That mid-point line is then extended into the future for a minimum of one quarter until the next earnings report and as long as a year with the current code.
This triangle plot allows you to see how a stock is trading RELATIVE TO where it was trading when earnings were announced and when a glimpse into the current quarter along with projections for the upcoming year.
Simply put: Key Earnings Levels are the easiest way to see how a stock is doing relative to the most important four days a year.
You can devise your own trading strategies around these levels, but I want you to have this information so you can see it and know it too. I've kept this little secret of Key Hidden Levels to myself and my followers in the Key Hidden Levels Chat Room here at TradingView for far too long. I have occasionally published charts with the Key Earnings Levels but have not made the code freely available to TradingView subscribers.
If anyone has paid me for access to these indicators and wants a refund, I will be glad to do that. This is too important to keep from everyone any longer. I think it is essential to make this available to everyone to make sure we all have the most advantage we can get when investing and trading in the markets.
I hope you can all find the powerful benefit from using Key Earnings Levels and please thank Johannes Falkenburg aka Vollchaot here at TradingView for writing the latest version of this code.
The idea itself came from using TradingView and the powerful graphing and layout features here to track our observations and to do research. Thank you TradingView for such a great product.
I look forward to answering any questions.
Sincerely,
Tim West
The most important FOUR days a year in a stock chart are the days that the company gives its quarterly update. Since the GRAND majority of companies have earnings, the indicator is called the "Key Earnings Level", or KEL for short. The unique part of the release of the quarterly update is that it can be "before the open" or "after the close" and the price action leading up to the earnings and immediately after the earnings are useful for future reference, as you'll see shortly.
The Key Earnings indicator plots a triangle for the range around the day before and the day after earnings and draws a mid-point line to capture the over/under level for that report. That mid-point line is then extended into the future for a minimum of one quarter until the next earnings report and as long as a year with the current code.
This triangle plot allows you to see how a stock is trading RELATIVE TO where it was trading when earnings were announced and when a glimpse into the current quarter along with projections for the upcoming year.
Simply put: Key Earnings Levels are the easiest way to see how a stock is doing relative to the most important four days a year.
You can devise your own trading strategies around these levels, but I want you to have this information so you can see it and know it too. I've kept this little secret of Key Hidden Levels to myself and my followers in the Key Hidden Levels Chat Room here at TradingView for far too long. I have occasionally published charts with the Key Earnings Levels but have not made the code freely available to TradingView subscribers.
If anyone has paid me for access to these indicators and wants a refund, I will be glad to do that. This is too important to keep from everyone any longer. I think it is essential to make this available to everyone to make sure we all have the most advantage we can get when investing and trading in the markets.
I hope you can all find the powerful benefit from using Key Earnings Levels and please thank Johannes Falkenburg aka Vollchaot here at TradingView for writing the latest version of this code.
The idea itself came from using TradingView and the powerful graphing and layout features here to track our observations and to do research. Thank you TradingView for such a great product.
I look forward to answering any questions.
Sincerely,
Tim West
오픈 소스 스크립트
트레이딩뷰의 진정한 정신에 따라, 이 스크립트의 작성자는 이를 오픈소스로 공개하여 트레이더들이 기능을 검토하고 검증할 수 있도록 했습니다. 작성자에게 찬사를 보냅니다! 이 코드는 무료로 사용할 수 있지만, 코드를 재게시하는 경우 하우스 룰이 적용된다는 점을 기억하세요.
Subscribe to my indicator package KEY HIDDEN LEVELS $10/mo or $100/year and join me in the trading room KEY HIDDEN LEVELS here at TradingView.com
면책사항
해당 정보와 게시물은 금융, 투자, 트레이딩 또는 기타 유형의 조언이나 권장 사항으로 간주되지 않으며, 트레이딩뷰에서 제공하거나 보증하는 것이 아닙니다. 자세한 내용은 이용 약관을 참조하세요.
오픈 소스 스크립트
트레이딩뷰의 진정한 정신에 따라, 이 스크립트의 작성자는 이를 오픈소스로 공개하여 트레이더들이 기능을 검토하고 검증할 수 있도록 했습니다. 작성자에게 찬사를 보냅니다! 이 코드는 무료로 사용할 수 있지만, 코드를 재게시하는 경우 하우스 룰이 적용된다는 점을 기억하세요.
면책사항
해당 정보와 게시물은 금융, 투자, 트레이딩 또는 기타 유형의 조언이나 권장 사항으로 간주되지 않으며, 트레이딩뷰에서 제공하거나 보증하는 것이 아닙니다. 자세한 내용은 이용 약관을 참조하세요.