OPEN-SOURCE SCRIPT
업데이트됨 Supports & Resistances [UAlgo]
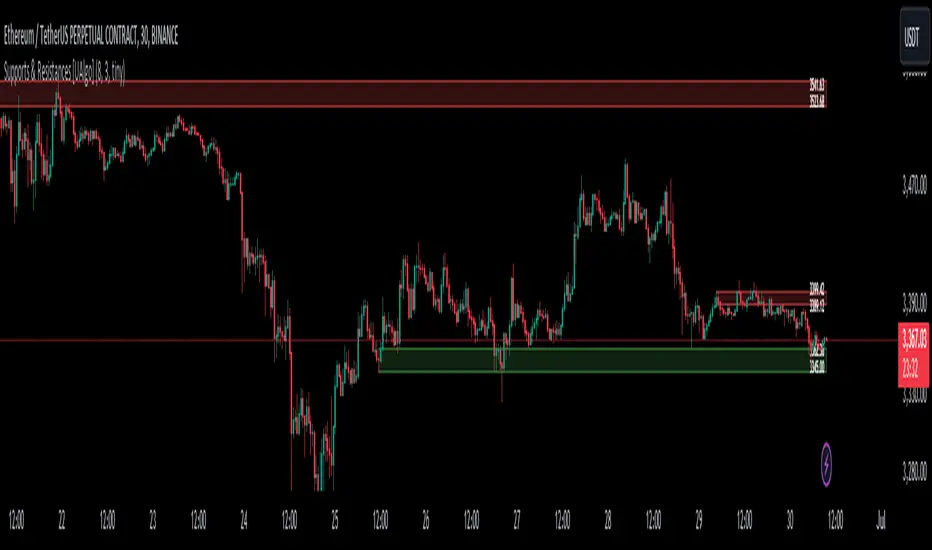
The "Supports & Resistances [UAlgo]" indicator is designed to identify and visualize key support and resistance levels on the price chart. It utilizes the Average True Range (ATR) and Pivot Points to define the boundaries of S & R zones and considers historical price action to assess the strength of these zones.
🔶 How to Obtain Zones
The script continuously analyzes the price action and identifies potential support and resistance zones based on the following criteria:
Zone Creation: For swing highs, a zone is created with the high price at the zone length as the top and the top minus the Average True Range (ATR) as the bottom. Conversely, for swing lows, the zone is created with the low price at the zone length as the bottom and the low plus the ATR as the top.

Zone Strength Calculation: The script iterates through historical bars within the zone and counts how many times the price (low for support, high for resistance) touched but failed to break entirely through the zone. This count is assigned as the zone's "strength".
Zone Display and Removal: It identifying zones by assigning a "strength" value based on how many times the price has approached but failed to break the zone. This helps prioritize stronger potential support/resistance levels. Only zones exceeding the defined "strength threshold" are visually displayed on the chart. Weaker zones or those broken by price are automatically removed.

🔶 Parameters
Zone Length: Traders can adjust S & R detection sensitivity, length to be used to find pivot points.
Strength Threshold: Set the minimum number of times the price needs to touch but fail to break a zone for it to be considered "strong" and displayed.
Visual Settings: Tailor the appearance of the support/resistance zones by defining separate colors and text size for borders, backgrounds, and zone text.
🔶 Disclaimer
The "Supports & Resistances [UAlgo]" indicator is provided for educational and informational purposes only.
It should not be considered as financial advice or a recommendation to buy or sell any financial instrument.
The use of this indicator involves inherent risks, and users should employ their own judgment and conduct their own research before making any trading decisions. Past performance is not indicative of future results.
🔷 Related Scripts
Support and Resistance with Signals [UAlgo]
https://www.tradingview.com/script/vPkSAk2e-Support-and-Resistance-with-Signals-UAlgo/
ATR Based Support and Resistance Zones [UAlgo]
https://www.tradingview.com/script/oY7rfzuc-ATR-Based-Support-and-Resistance-Zones-UAlgo/
🔶 How to Obtain Zones
The script continuously analyzes the price action and identifies potential support and resistance zones based on the following criteria:
Zone Creation: For swing highs, a zone is created with the high price at the zone length as the top and the top minus the Average True Range (ATR) as the bottom. Conversely, for swing lows, the zone is created with the low price at the zone length as the bottom and the low plus the ATR as the top.
Zone Strength Calculation: The script iterates through historical bars within the zone and counts how many times the price (low for support, high for resistance) touched but failed to break entirely through the zone. This count is assigned as the zone's "strength".
Zone Display and Removal: It identifying zones by assigning a "strength" value based on how many times the price has approached but failed to break the zone. This helps prioritize stronger potential support/resistance levels. Only zones exceeding the defined "strength threshold" are visually displayed on the chart. Weaker zones or those broken by price are automatically removed.
🔶 Parameters
Zone Length: Traders can adjust S & R detection sensitivity, length to be used to find pivot points.
Strength Threshold: Set the minimum number of times the price needs to touch but fail to break a zone for it to be considered "strong" and displayed.
Visual Settings: Tailor the appearance of the support/resistance zones by defining separate colors and text size for borders, backgrounds, and zone text.
🔶 Disclaimer
The "Supports & Resistances [UAlgo]" indicator is provided for educational and informational purposes only.
It should not be considered as financial advice or a recommendation to buy or sell any financial instrument.
The use of this indicator involves inherent risks, and users should employ their own judgment and conduct their own research before making any trading decisions. Past performance is not indicative of future results.
🔷 Related Scripts
Support and Resistance with Signals [UAlgo]
https://www.tradingview.com/script/vPkSAk2e-Support-and-Resistance-with-Signals-UAlgo/
ATR Based Support and Resistance Zones [UAlgo]
https://www.tradingview.com/script/oY7rfzuc-ATR-Based-Support-and-Resistance-Zones-UAlgo/
릴리즈 노트
"Invalid number of bars back" Error fixed.오픈 소스 스크립트
트레이딩뷰의 진정한 정신에 따라, 이 스크립트의 작성자는 이를 오픈소스로 공개하여 트레이더들이 기능을 검토하고 검증할 수 있도록 했습니다. 작성자에게 찬사를 보냅니다! 이 코드는 무료로 사용할 수 있지만, 코드를 재게시하는 경우 하우스 룰이 적용된다는 점을 기억하세요.
Get exclusive indicators: pinescriptmarket.com
All content provided by UAlgo is for informational & educational purposes only. Past performance does not guarantee future results.
All content provided by UAlgo is for informational & educational purposes only. Past performance does not guarantee future results.
면책사항
해당 정보와 게시물은 금융, 투자, 트레이딩 또는 기타 유형의 조언이나 권장 사항으로 간주되지 않으며, 트레이딩뷰에서 제공하거나 보증하는 것이 아닙니다. 자세한 내용은 이용 약관을 참조하세요.
오픈 소스 스크립트
트레이딩뷰의 진정한 정신에 따라, 이 스크립트의 작성자는 이를 오픈소스로 공개하여 트레이더들이 기능을 검토하고 검증할 수 있도록 했습니다. 작성자에게 찬사를 보냅니다! 이 코드는 무료로 사용할 수 있지만, 코드를 재게시하는 경우 하우스 룰이 적용된다는 점을 기억하세요.
Get exclusive indicators: pinescriptmarket.com
All content provided by UAlgo is for informational & educational purposes only. Past performance does not guarantee future results.
All content provided by UAlgo is for informational & educational purposes only. Past performance does not guarantee future results.
면책사항
해당 정보와 게시물은 금융, 투자, 트레이딩 또는 기타 유형의 조언이나 권장 사항으로 간주되지 않으며, 트레이딩뷰에서 제공하거나 보증하는 것이 아닙니다. 자세한 내용은 이용 약관을 참조하세요.