OPEN-SOURCE SCRIPT
Market Session Times and Volume [Market Spotter]
Market Session Times and Volume
Market Session Times
Inputs
The inputs tab consists of timezone adjustment which would be the chosen timezone for the plotting of the market sessions based on the market timings.
Further it contains settings for each box to show/hide and change box colour and timings for Asian, London and New York Sessions.

How it works
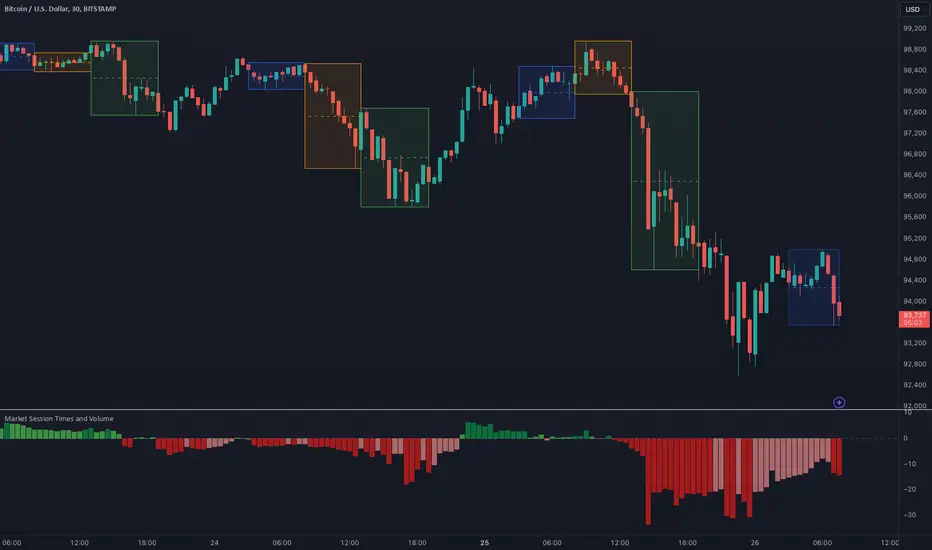
The indicator primarily works by marking the session highs and lows for the chosen time in the inputs, each of the sessions can be input a custom time value which would plot the box. It helps to identify the important price levels and the trading range for each individual session.
The midpoint of each session is marked with a dashed line. The indicator also marks a developing session while it being formed as well to identify potential secondary levels.
Usage
It can be used to trade session breakouts, false breaks and also divide the daily movement into parts and identify possible patterns while trading.
2. Volumes
Inputs
The volume part has 2 inputs - Smoothing and Normalisation. The smoothing period can simply be used to take in charge volumes of last X bars and normalisation can be used for calculating relative volumes based on last Y bars.

How it works
The indicator takes into account the buy and sell volumes of last X bars and then displays that as a relative smoothed volume which helps to identify longer term build or distribution of volume. It plots the positive volume from 0 to 100 and negative volume from 0 to -100 which has been normalised. The colors identify gradual increase or decrease in volumes
Usage
It can also be used to trade volume spikes well and can identify potential market shifts
Market Session Times
Inputs
The inputs tab consists of timezone adjustment which would be the chosen timezone for the plotting of the market sessions based on the market timings.
Further it contains settings for each box to show/hide and change box colour and timings for Asian, London and New York Sessions.
How it works
The indicator primarily works by marking the session highs and lows for the chosen time in the inputs, each of the sessions can be input a custom time value which would plot the box. It helps to identify the important price levels and the trading range for each individual session.
The midpoint of each session is marked with a dashed line. The indicator also marks a developing session while it being formed as well to identify potential secondary levels.
Usage
It can be used to trade session breakouts, false breaks and also divide the daily movement into parts and identify possible patterns while trading.
2. Volumes
Inputs
The volume part has 2 inputs - Smoothing and Normalisation. The smoothing period can simply be used to take in charge volumes of last X bars and normalisation can be used for calculating relative volumes based on last Y bars.
How it works
The indicator takes into account the buy and sell volumes of last X bars and then displays that as a relative smoothed volume which helps to identify longer term build or distribution of volume. It plots the positive volume from 0 to 100 and negative volume from 0 to -100 which has been normalised. The colors identify gradual increase or decrease in volumes
Usage
It can also be used to trade volume spikes well and can identify potential market shifts
오픈 소스 스크립트
트레이딩뷰의 진정한 정신에 따라, 이 스크립트의 작성자는 이를 오픈소스로 공개하여 트레이더들이 기능을 검토하고 검증할 수 있도록 했습니다. 작성자에게 찬사를 보냅니다! 이 코드는 무료로 사용할 수 있지만, 코드를 재게시하는 경우 하우스 룰이 적용된다는 점을 기억하세요.
면책사항
해당 정보와 게시물은 금융, 투자, 트레이딩 또는 기타 유형의 조언이나 권장 사항으로 간주되지 않으며, 트레이딩뷰에서 제공하거나 보증하는 것이 아닙니다. 자세한 내용은 이용 약관을 참조하세요.
오픈 소스 스크립트
트레이딩뷰의 진정한 정신에 따라, 이 스크립트의 작성자는 이를 오픈소스로 공개하여 트레이더들이 기능을 검토하고 검증할 수 있도록 했습니다. 작성자에게 찬사를 보냅니다! 이 코드는 무료로 사용할 수 있지만, 코드를 재게시하는 경우 하우스 룰이 적용된다는 점을 기억하세요.
면책사항
해당 정보와 게시물은 금융, 투자, 트레이딩 또는 기타 유형의 조언이나 권장 사항으로 간주되지 않으며, 트레이딩뷰에서 제공하거나 보증하는 것이 아닙니다. 자세한 내용은 이용 약관을 참조하세요.