OPEN-SOURCE SCRIPT
Smooth First Derivative Indicator
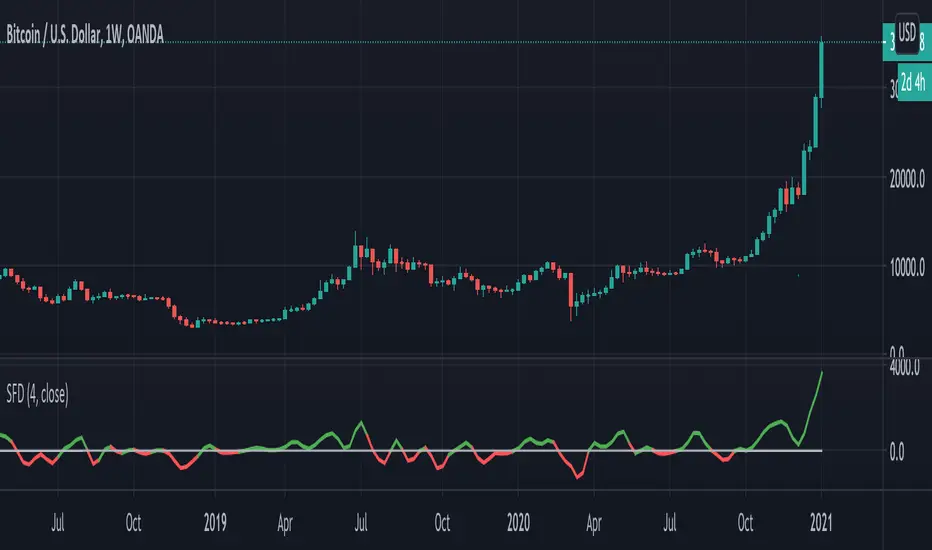
Introducing the Smooth First Derivative indicator. For each time step, the script numerically differentiates the price data using prior datapoints from the look-back window. The resulting time derivative (the rate of price change over time) is presented as a centered oscillator.
A first derivative is a versatile tool used in functional data analysis. When applied to price data, it can be applied to analyze momentum, confirm trend direction, and identify pivot points.
Model Description:
The model assumes that, within the look-back window, price data can be well approximated by a smooth differentiable function. The first derivative can then be computed numerically using a noise-robust one-sided differentiator. The current version of the script employs smooth differentiators developed by P. Holoborodko (holoborodko.com/pavel/numerical-methods/numerical-derivative/smooth-low-noise-differentiators/). Note that the Indicator should not be confused with Constance Brown's Derivative Oscillator.
Input parameter:
The Bandwidth parameter sets the number of points in the moving look-back window and thus determines the smoothness of the first derivative curve. Note that a smoother Indicator shows a greater lag.
Interpretation:
When using this Indicator, one should recall that the first derivative can simply be interpreted as the slope of the curve:
- The maximum (minimum) in the Indicator corresponds to the point at which the market experiences the maximum upward (downward) slope, i.e., the inflection point. The steeper the slope, the greater the Indicator value.
- The positive-to-negative zero-crossing in the Indicator suggests that the market has formed a local maximum (potential start of a downtrend or a period of consolidation). Likewise, a zero-crossing from negative to positive is a potential bullish signal.
오픈 소스 스크립트
트레이딩뷰의 진정한 정신에 따라, 이 스크립트의 작성자는 이를 오픈소스로 공개하여 트레이더들이 기능을 검토하고 검증할 수 있도록 했습니다. 작성자에게 찬사를 보냅니다! 이 코드는 무료로 사용할 수 있지만, 코드를 재게시하는 경우 하우스 룰이 적용된다는 점을 기억하세요.
면책사항
해당 정보와 게시물은 금융, 투자, 트레이딩 또는 기타 유형의 조언이나 권장 사항으로 간주되지 않으며, 트레이딩뷰에서 제공하거나 보증하는 것이 아닙니다. 자세한 내용은 이용 약관을 참조하세요.
오픈 소스 스크립트
트레이딩뷰의 진정한 정신에 따라, 이 스크립트의 작성자는 이를 오픈소스로 공개하여 트레이더들이 기능을 검토하고 검증할 수 있도록 했습니다. 작성자에게 찬사를 보냅니다! 이 코드는 무료로 사용할 수 있지만, 코드를 재게시하는 경우 하우스 룰이 적용된다는 점을 기억하세요.
면책사항
해당 정보와 게시물은 금융, 투자, 트레이딩 또는 기타 유형의 조언이나 권장 사항으로 간주되지 않으며, 트레이딩뷰에서 제공하거나 보증하는 것이 아닙니다. 자세한 내용은 이용 약관을 참조하세요.