OPEN-SOURCE SCRIPT
ARIMA Indicator with Optional Smoothing

Overview
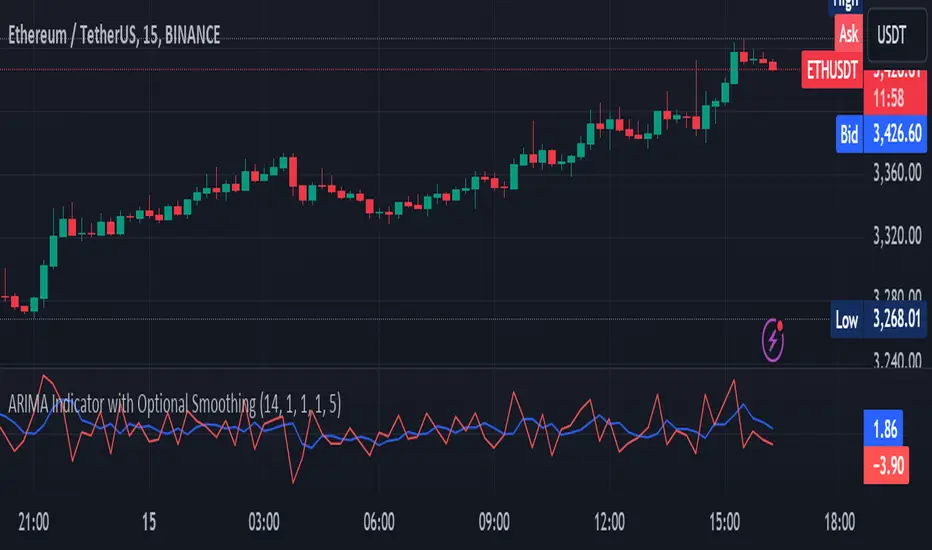
The ARIMA (AutoRegressive Integrated Moving Average) Indicator is a powerful tool used to forecast future price movements by combining differencing, autoregressive, and moving average components. This indicator is designed to help traders identify trends and potential reversal points by analyzing the historical price data.
Key Features
Concepts Underlying the Calculations
How It Works
The ARIMA Indicator first calculates the differenced series to achieve stationarity. Then, it computes the simple moving average (SMA) of this differenced series. The indicator uses the AR and MA components to adjust the SMA, creating an approximation of the ARIMA model. Finally, an optional smoothing step using EMA can be applied to the ARIMA approximation to produce a smoother signal.
How Traders Can Use It
Traders can use the ARIMA Indicator to:
Example Usage Instructions
The ARIMA (AutoRegressive Integrated Moving Average) Indicator is a powerful tool used to forecast future price movements by combining differencing, autoregressive, and moving average components. This indicator is designed to help traders identify trends and potential reversal points by analyzing the historical price data.
Key Features
- AutoRegressive Component (AR): Utilizes past values to predict future prices.
- Moving Average Component (MA): Averages past price differences to smooth out noise.
- Differencing: Reduces non-stationarity in the time series data.
- Optional Smoothing: Applies EMA to the ARIMA output for a smoother signal.
- Customizable Parameters: Allows users to adjust AR and MA orders, differencing periods, and smoothing lengths.
Concepts Underlying the Calculations
- Differencing: Subtracts previous prices from current prices to remove trends and seasonality, making the data stationary.
- AutoRegressive Component (AR): Predicts future prices based on a linear combination of past values.
- Moving Average Component (MA): Uses past forecast errors to refine future predictions.
- Exponential Moving Average (EMA): Applies more weight to recent prices, providing a smoother and more responsive signal.
How It Works
The ARIMA Indicator first calculates the differenced series to achieve stationarity. Then, it computes the simple moving average (SMA) of this differenced series. The indicator uses the AR and MA components to adjust the SMA, creating an approximation of the ARIMA model. Finally, an optional smoothing step using EMA can be applied to the ARIMA approximation to produce a smoother signal.
How Traders Can Use It
Traders can use the ARIMA Indicator to:
- Identify Trends: Detect emerging trends by observing the direction of the ARIMA line.
- Spot Reversals: Look for divergences between the ARIMA line and the price to identify potential reversal points.
- Generate Trading Signals: Use crossovers between the ARIMA line and the price to generate buy or sell signals.
- Filter Noise: Enable the optional smoothing to filter out market noise and focus on significant price movements.
Example Usage Instructions
- Add the ARIMA Indicator to your chart.
- Adjust the input parameters to suit your trading strategy:
- Set the SMA Length (e.g., 14).
- Choose the Differencing Period (e.g., 1).
- Define the AR Order (p) and MA Order (q) (e.g., 1).
- Configure the Smoothing Length if smoothing is desired (e.g., 5).
- Enable or disable smoothing as needed.
- Observe the ARIMA line (blue) and compare it to the price chart.
- Use the ARIMA line to identify trends and potential reversals.
- Implement trading decisions based on the ARIMA line’s behavior relative to the price.
오픈 소스 스크립트
트레이딩뷰의 진정한 정신에 따라, 이 스크립트의 작성자는 이를 오픈소스로 공개하여 트레이더들이 기능을 검토하고 검증할 수 있도록 했습니다. 작성자에게 찬사를 보냅니다! 이 코드는 무료로 사용할 수 있지만, 코드를 재게시하는 경우 하우스 룰이 적용된다는 점을 기억하세요.
면책사항
해당 정보와 게시물은 금융, 투자, 트레이딩 또는 기타 유형의 조언이나 권장 사항으로 간주되지 않으며, 트레이딩뷰에서 제공하거나 보증하는 것이 아닙니다. 자세한 내용은 이용 약관을 참조하세요.
오픈 소스 스크립트
트레이딩뷰의 진정한 정신에 따라, 이 스크립트의 작성자는 이를 오픈소스로 공개하여 트레이더들이 기능을 검토하고 검증할 수 있도록 했습니다. 작성자에게 찬사를 보냅니다! 이 코드는 무료로 사용할 수 있지만, 코드를 재게시하는 경우 하우스 룰이 적용된다는 점을 기억하세요.
면책사항
해당 정보와 게시물은 금융, 투자, 트레이딩 또는 기타 유형의 조언이나 권장 사항으로 간주되지 않으며, 트레이딩뷰에서 제공하거나 보증하는 것이 아닙니다. 자세한 내용은 이용 약관을 참조하세요.