OPEN-SOURCE SCRIPT
Price Percentage Shaded Candles
Description:
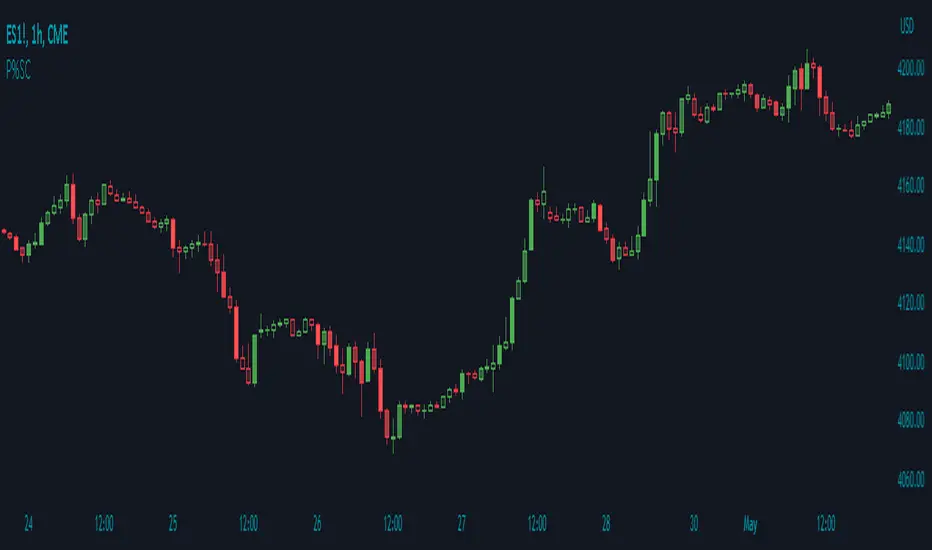
The Price Percentage Shaded Candles indicator (P%SC) is a technical analysis tool designed to represent price candles on a chart with shading intensity based on the percentage change between the open and close prices. This overlay indicator enhances visual analysis by providing a visual representation of price movement intensity.
How it Works:
The P%SC indicator calculates the percentage change between the open and close prices of each candle. It then determines the shading intensity of the price candles based on this percentage change. Higher percentage changes result in darker shading, while lower percentage changes result in lighter shading.
Usage:
To effectively utilize the Price Percentage Shaded Candles indicator, follow these steps:
1. Apply the Price Percentage Shaded Candles indicator to your chart by adding it from the available indicators.
2. Configure the indicator's inputs:
- Specify the color for bullish candles using the "Bullish Color" input.
- Specify the color for bearish candles using the "Bearish Color" input.
3. Observe the shaded candles on the chart:
- Bullish candles are colored with the specified bullish color and shaded according to the percentage change.
- Bearish candles are colored with the specified bearish color and shaded according to the percentage change.
4. Interpret the shaded candles:
- Darker shading indicates a higher percentage change and stronger price movement during the corresponding candle.
- Lighter shading indicates a lower percentage change and weaker price movement during the corresponding candle.
5. Combine the analysis of shaded candles with other technical analysis tools, such as trend lines, support and resistance levels, or candlestick patterns, to identify potential trade setups.
6. Implement appropriate risk management strategies, including setting stop-loss orders and position sizing, to manage your trades effectively and protect your capital.
Note: The Price Percentage Shaded Candles indicator provides insights into the shading intensity of price candles based on percentage changes. However, it is recommended to use this indicator in conjunction with other technical analysis tools and perform thorough analysis before making trading decisions.
오픈 소스 스크립트
트레이딩뷰의 진정한 정신에 따라, 이 스크립트의 작성자는 이를 오픈소스로 공개하여 트레이더들이 기능을 검토하고 검증할 수 있도록 했습니다. 작성자에게 찬사를 보냅니다! 이 코드는 무료로 사용할 수 있지만, 코드를 재게시하는 경우 하우스 룰이 적용된다는 점을 기억하세요.
면책사항
해당 정보와 게시물은 금융, 투자, 트레이딩 또는 기타 유형의 조언이나 권장 사항으로 간주되지 않으며, 트레이딩뷰에서 제공하거나 보증하는 것이 아닙니다. 자세한 내용은 이용 약관을 참조하세요.
오픈 소스 스크립트
트레이딩뷰의 진정한 정신에 따라, 이 스크립트의 작성자는 이를 오픈소스로 공개하여 트레이더들이 기능을 검토하고 검증할 수 있도록 했습니다. 작성자에게 찬사를 보냅니다! 이 코드는 무료로 사용할 수 있지만, 코드를 재게시하는 경우 하우스 룰이 적용된다는 점을 기억하세요.
면책사항
해당 정보와 게시물은 금융, 투자, 트레이딩 또는 기타 유형의 조언이나 권장 사항으로 간주되지 않으며, 트레이딩뷰에서 제공하거나 보증하는 것이 아닙니다. 자세한 내용은 이용 약관을 참조하세요.