OPEN-SOURCE SCRIPT
Relative Volume Indicator (RVOL)
Relative Volume Indicator (RVOL)
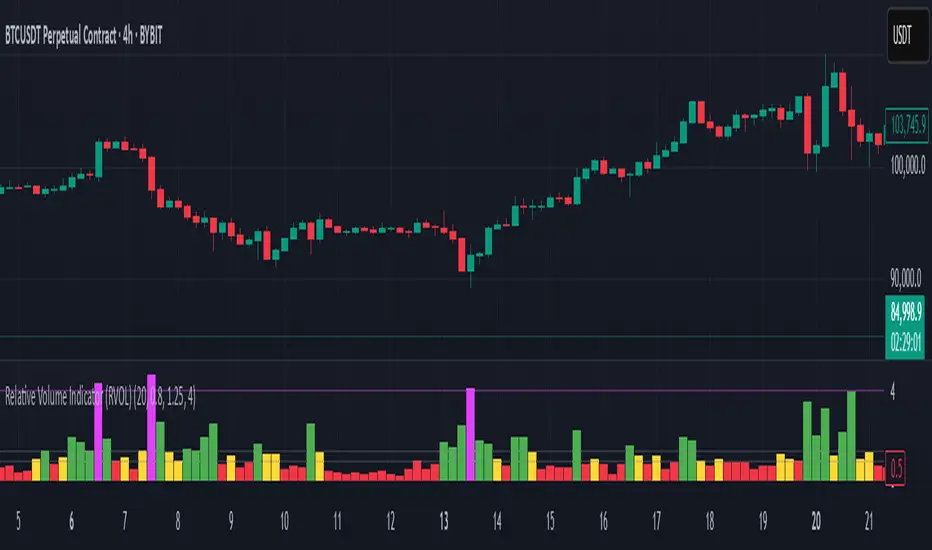
The Relative Volume Indicator (RVOL) helps traders identify unusual volume activity by comparing the current volume to the average historical volume. This makes it easier to spot potential breakouts, reversals, or significant market events that are accompanied by volume confirmation.
What This Indicator Shows
This indicator displays volume as a multiple of average volume, where:
- 1.0x means 100% of average volume
- 2.0x means 200% of average volume (twice the average)
- 0.5x means 50% of average volume (half the average)
Color Coding
The volume bars are color-coded based on configurable thresholds:
- Red: Below average volume (< Average Volume Threshold)
- Yellow: Average volume (between Average Volume and Above Average thresholds)
- Green: Above average volume (between Above Average and Extreme thresholds)
- Magenta: Extreme volume (> Extreme Volume Threshold)
Horizontal Reference Lines
Three dotted horizontal reference lines help you visualize the thresholds:
- Lower gray line: Average Volume Threshold (default: 0.8x)
- Upper gray line: Above Average Threshold (default: 1.25x)
- Magenta line: Extreme Volume Threshold (default: 4.0x)
How To Use This Indicator
1. Volume Confirmation: Use green bars to confirm breakouts or trend changes - stronger moves often come with above-average volume.
2. Low Volume Warning: Red bars during price movements may indicate weak conviction and potential reversals.
3. Extreme Volume Events: Magenta bars (extreme volume) often signal major market events or potential exhaustion points that could lead to reversals.
4. Volume Divergence: Look for divergences between price and volume - for example, if price makes new highs but volume is decreasing (more yellow/red bars), the move may be losing strength.
Settings Configuration
- Average Volume Lookback Period: Number of bars used to calculate the average volume (default: 20)
- Average Volume Threshold: Volume below this level is considered below average (default: 0.8x)
- Above Average Threshold: Volume above this level is considered above average (default: 1.25x)
- Extreme Volume Threshold: Volume above this level is considered extreme (default: 4.0x)
- Colors: Customize colors for each volume category
Important Note: Adjust threshold values only through the indicator settings (not in the Style tab). Changing values in the Style tab will not adjust the coloring of the volume bars.
Adjust these settings based on the specific asset being analyzed and your trading timeframe. More volatile assets may require higher thresholds, while less volatile ones might need lower thresholds.
오픈 소스 스크립트
트레이딩뷰의 진정한 정신에 따라, 이 스크립트의 작성자는 이를 오픈소스로 공개하여 트레이더들이 기능을 검토하고 검증할 수 있도록 했습니다. 작성자에게 찬사를 보냅니다! 이 코드는 무료로 사용할 수 있지만, 코드를 재게시하는 경우 하우스 룰이 적용된다는 점을 기억하세요.
Full time Retail Algo Trader. pine-strategies.com
면책사항
해당 정보와 게시물은 금융, 투자, 트레이딩 또는 기타 유형의 조언이나 권장 사항으로 간주되지 않으며, 트레이딩뷰에서 제공하거나 보증하는 것이 아닙니다. 자세한 내용은 이용 약관을 참조하세요.