OPEN-SOURCE SCRIPT
[CM]EMA Trend Cross STRAT
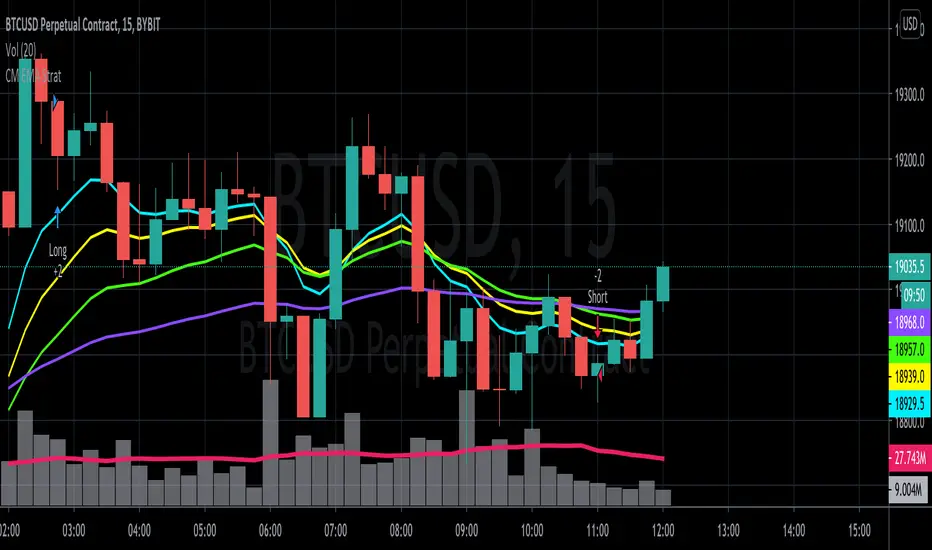
VISUALLY REPRESENTS THE CROSSING OF 8,13,21,55 EMA'S FROM KROWNS TA PROGRAM
Hello everybody! I was curious and wanted to see how the Strat described in one of the modules would look coded. So here we are, a clear cut visual representation of the methods talked about in the course from the EMA Module. Enjoy!
(Instructions)
Whenever the 8,13,21 all cross above the 55ema that constitutes a long signal.
On the flip side, whenever the 8,13,21 all cross below the 55ema that constitutes a short signal.
(Description)
This indicator shows the cross described in the TA program using the EMAS 8,13,21,55.
The Ema's are editable.(Color)
It plots the entry and exit parameters.
This allows for a more visual representation of the ideology described in the course.
This indicator also doesn't leave room for ambiguity in terms of where a cross happens.
The EMA's can be toggled to show certain ones at certain times.
The indicator can be used as a trend analysis tool.
***In terms of an exit, I find it to be better to use your own judgement, taking account the greater trend.
For example, in a bull market I would advise looking for long signals, rather than try to hop on a counter trend play. Vice Versa in a bear market. It's better for jumping in to the greater momentum.
오픈 소스 스크립트
트레이딩뷰의 진정한 정신에 따라, 이 스크립트의 작성자는 이를 오픈소스로 공개하여 트레이더들이 기능을 검토하고 검증할 수 있도록 했습니다. 작성자에게 찬사를 보냅니다! 이 코드는 무료로 사용할 수 있지만, 코드를 재게시하는 경우 하우스 룰이 적용된다는 점을 기억하세요.
면책사항
해당 정보와 게시물은 금융, 투자, 트레이딩 또는 기타 유형의 조언이나 권장 사항으로 간주되지 않으며, 트레이딩뷰에서 제공하거나 보증하는 것이 아닙니다. 자세한 내용은 이용 약관을 참조하세요.
오픈 소스 스크립트
트레이딩뷰의 진정한 정신에 따라, 이 스크립트의 작성자는 이를 오픈소스로 공개하여 트레이더들이 기능을 검토하고 검증할 수 있도록 했습니다. 작성자에게 찬사를 보냅니다! 이 코드는 무료로 사용할 수 있지만, 코드를 재게시하는 경우 하우스 룰이 적용된다는 점을 기억하세요.
면책사항
해당 정보와 게시물은 금융, 투자, 트레이딩 또는 기타 유형의 조언이나 권장 사항으로 간주되지 않으며, 트레이딩뷰에서 제공하거나 보증하는 것이 아닙니다. 자세한 내용은 이용 약관을 참조하세요.