OPEN-SOURCE SCRIPT
업데이트됨 [Venturose] MACD x BB x STDEV x RVI
Description:
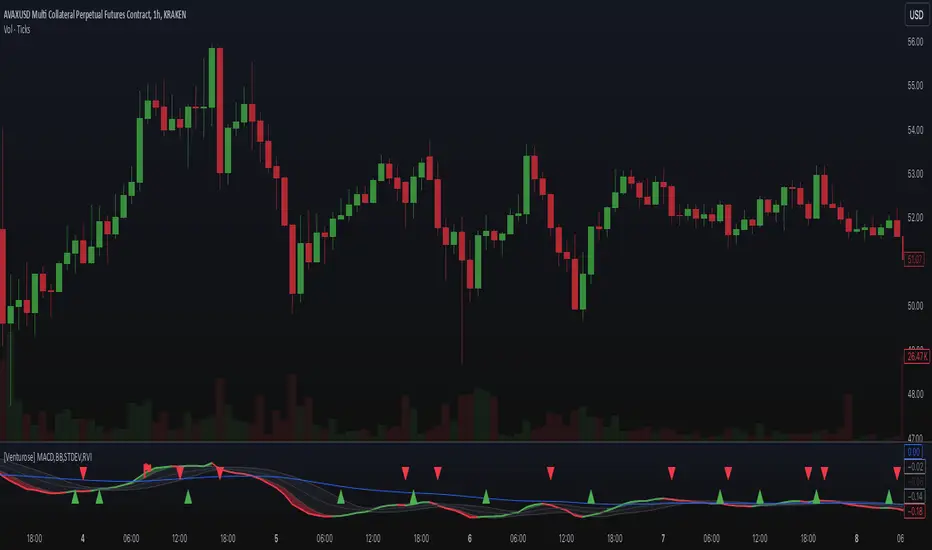
The [Venturose] MACD x BB x STDEV x RVI combines MACD, Bollinger Bands, Standard Deviation, and Relative Volatility Index into a single tool. This indicator is designed to provide insights into market trends, momentum, and volatility. It generates buy and sell signals, by analyzing the interactions between these components. These buy and sell signals are not literal, and should be used in combination with the current trend.
How It Works:
Key Features:
Why It’s Unique:
This indicator combines momentum (MACD), volatility (Bollinger Bands and Standard Deviation), and confirmation signals (RVI thresholds) into a unified system. It introduces custom "inside" and "flipped" triggers for adaptable signal generation and includes signal filtering to reduce noise. The addition of RVI-based hints helps identify early overbought or oversold conditions, providing an extra layer of insight for decision-making. The dynamic integration of these components ensures a comprehensive yet straightforward analysis tool for various market conditions.
The [Venturose] MACD x BB x STDEV x RVI combines MACD, Bollinger Bands, Standard Deviation, and Relative Volatility Index into a single tool. This indicator is designed to provide insights into market trends, momentum, and volatility. It generates buy and sell signals, by analyzing the interactions between these components. These buy and sell signals are not literal, and should be used in combination with the current trend.
How It Works:
- MACD: Tracks momentum and trend direction using customizable fast and slow EMA periods.
- Bollinger Bands: Adds volatility bands to MACD to identify overextension zones.
- Standard Deviation: Dynamically adjusts the Bollinger Band width based on MACD volatility.
- RVI (Relative Volatility Index): Confirms momentum extremes with upper and lower threshold markers.
- Custom Logic: Includes a trigger system ("inside" or "flipped") to adapt signals to various market conditions and an optional filter to reduce noise.
Key Features:
- Combines MACD and Bollinger Bands with volatility and momentum confirmations from RVI.
- Dynamic color-coded plots for identifying bullish, bearish, and neutral trends.
- Customizable parameters for tailoring the indicator to different strategies.
- Optional signal filtering to refine buy and sell triggers.
- Alerts for buy and sell signals based on signal logic.
Why It’s Unique:
This indicator combines momentum (MACD), volatility (Bollinger Bands and Standard Deviation), and confirmation signals (RVI thresholds) into a unified system. It introduces custom "inside" and "flipped" triggers for adaptable signal generation and includes signal filtering to reduce noise. The addition of RVI-based hints helps identify early overbought or oversold conditions, providing an extra layer of insight for decision-making. The dynamic integration of these components ensures a comprehensive yet straightforward analysis tool for various market conditions.
릴리즈 노트
New Update: Long-Term Average Smoothing with CustomizationThis update introduces a customizable EMA for smoothing the long-term average. You can tailor the period and color to suit your preferences, allowing for a personalized visualization. Note that while this feature enhances trend clarity, it does not currently impact the indicator's signals.
오픈 소스 스크립트
트레이딩뷰의 진정한 정신에 따라, 이 스크립트의 작성자는 이를 오픈소스로 공개하여 트레이더들이 기능을 검토하고 검증할 수 있도록 했습니다. 작성자에게 찬사를 보냅니다! 이 코드는 무료로 사용할 수 있지만, 코드를 재게시하는 경우 하우스 룰이 적용된다는 점을 기억하세요.
면책사항
해당 정보와 게시물은 금융, 투자, 트레이딩 또는 기타 유형의 조언이나 권장 사항으로 간주되지 않으며, 트레이딩뷰에서 제공하거나 보증하는 것이 아닙니다. 자세한 내용은 이용 약관을 참조하세요.
오픈 소스 스크립트
트레이딩뷰의 진정한 정신에 따라, 이 스크립트의 작성자는 이를 오픈소스로 공개하여 트레이더들이 기능을 검토하고 검증할 수 있도록 했습니다. 작성자에게 찬사를 보냅니다! 이 코드는 무료로 사용할 수 있지만, 코드를 재게시하는 경우 하우스 룰이 적용된다는 점을 기억하세요.
면책사항
해당 정보와 게시물은 금융, 투자, 트레이딩 또는 기타 유형의 조언이나 권장 사항으로 간주되지 않으며, 트레이딩뷰에서 제공하거나 보증하는 것이 아닙니다. 자세한 내용은 이용 약관을 참조하세요.