INVITE-ONLY SCRIPT
업데이트됨 Alcides Indicator(AI) Lite

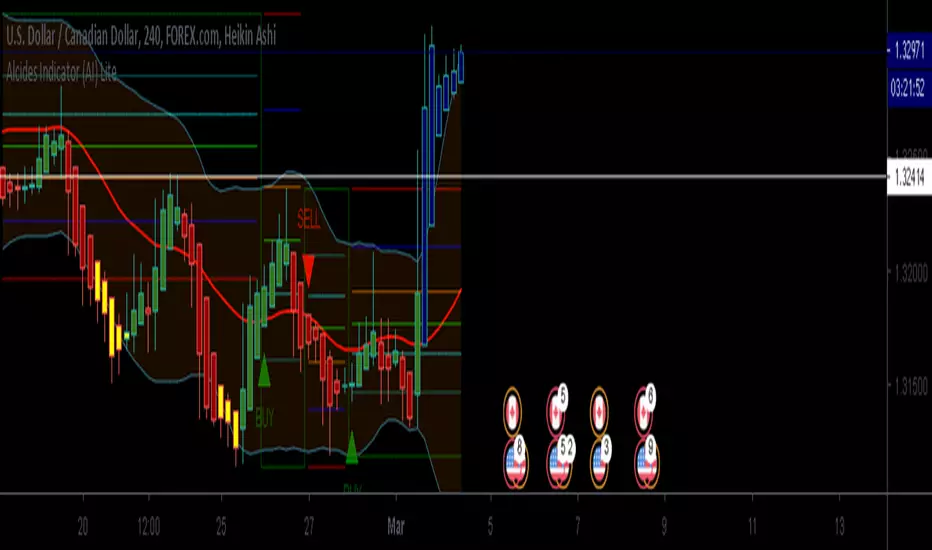
Alcides Indicator (AI) Lite is a simple to use indicator that can be used with any type of asset, trading in any market including FOREX, Stocks, Commodities, Cryptocurrencies etc. The Lite version uses levels from either 1 hr or 4 hr time frame based on user input to indicate entry (BUY) into or exit (SELL) from an asset. The indicator also plots support for BUYs and Resistance for SELLs which can be used as a reference while setting your Stop Loss. BUY, SELL and TAKE GAINS alerts can be set on trading view to help monitor the asset as well.
Even though the indicator signals BUYs and SELLs based on chosen Time Frame levels, the user must always use their discretion based on their TA and FA. Also, indicator repainting can occur based on time of signal/chart used (ex. 5m chart on 1 hr timeframe levels can repaint a BUY/SELL after 1 hr closes).
Works best with Heikin Ashi candles and lower timeframes like 5m, 15m, 30m.
The full version has more time frame levels to choose from, a few extra useful features and also recommends sell and buy levels based on the chosen time from.
Contact me for access and more information.
릴리즈 노트
Updated - Resolution instead of Timeframe for levels - 1m, 3m, 5m, 15m, 30m, 45m, 1hr, 2hr, 3hr, 1D, 1WAdded - Support/Resistance levels based on Fibonacci levels for chosen timeframe.
Added - Ability to specify % for Take Gains
릴리즈 노트
Added: Ability to show/hide FIB levels릴리즈 노트
Take Gains option removed as it wasn't adding any value.Default Alt timeframe - 3h
Note: Always use lower timeframe chart view than Indicator settings Timeframe
릴리즈 노트
Thanks for your support릴리즈 노트
Added - Ability to view Daily chart BUY/SELL with levels - Use 1W Alt Timeframe릴리즈 노트
Note added for new users at the top of Indicator settingsAlways use Higher Alt Time Frame than the Chart View Timeframe
Signal repainting possible - Use levels
릴리즈 노트
Updated - Simpler options for type of trade rather than alt TFAdded - Fib levels - 1.272, 1.414 and 1.618
릴리즈 노트
Added: Option to paint Oversold and Overbought RSI levels on candles - Choose the oversold and overbought levels to paint from the settings screen.
Updated:
Support/Resistance levels only show when BUY/SELL signals option is enabled.
릴리즈 노트
Thanks for your support.릴리즈 노트
Change colors/ fills from styles tab on the indicator settings to suit your background colour.릴리즈 노트
Added - Option to add Heikin Ashi Ichimoku to the chart from settings.Updated - Oversold levels up to 10 and Overbought levels up to 100 on RSI color candles
BUY/SELL + levels disabled on Daily/weekly charts
릴리즈 노트
Use BUY/SELL signals along with RSI candles, Ichimoku and Bollinger bands to make an informed decision and use levels.초대 전용 스크립트
이 스크립트는 작성자가 승인한 사용자만 접근할 수 있습니다. 사용하려면 요청 후 승인을 받아야 하며, 일반적으로 결제 후에 허가가 부여됩니다. 자세한 내용은 아래 작성자의 안내를 따르거나 TradeChartist에게 직접 문의하세요.
트레이딩뷰는 스크립트의 작동 방식을 충분히 이해하고 작성자를 완전히 신뢰하지 않는 이상, 해당 스크립트에 비용을 지불하거나 사용하는 것을 권장하지 않습니다. 커뮤니티 스크립트에서 무료 오픈소스 대안을 찾아보실 수도 있습니다.
작성자 지시 사항
Get in touch with me if you would like access to my Premium scripts for a trial before deciding on lifetime access.
Telegram - @Trade_Chartist
Free Scripts - bit.ly/Free-Scripts
Telegram - @Trade_Chartist
Free Scripts - bit.ly/Free-Scripts
면책사항
해당 정보와 게시물은 금융, 투자, 트레이딩 또는 기타 유형의 조언이나 권장 사항으로 간주되지 않으며, 트레이딩뷰에서 제공하거나 보증하는 것이 아닙니다. 자세한 내용은 이용 약관을 참조하세요.
초대 전용 스크립트
이 스크립트는 작성자가 승인한 사용자만 접근할 수 있습니다. 사용하려면 요청 후 승인을 받아야 하며, 일반적으로 결제 후에 허가가 부여됩니다. 자세한 내용은 아래 작성자의 안내를 따르거나 TradeChartist에게 직접 문의하세요.
트레이딩뷰는 스크립트의 작동 방식을 충분히 이해하고 작성자를 완전히 신뢰하지 않는 이상, 해당 스크립트에 비용을 지불하거나 사용하는 것을 권장하지 않습니다. 커뮤니티 스크립트에서 무료 오픈소스 대안을 찾아보실 수도 있습니다.
작성자 지시 사항
Get in touch with me if you would like access to my Premium scripts for a trial before deciding on lifetime access.
Telegram - @Trade_Chartist
Free Scripts - bit.ly/Free-Scripts
Telegram - @Trade_Chartist
Free Scripts - bit.ly/Free-Scripts
면책사항
해당 정보와 게시물은 금융, 투자, 트레이딩 또는 기타 유형의 조언이나 권장 사항으로 간주되지 않으며, 트레이딩뷰에서 제공하거나 보증하는 것이 아닙니다. 자세한 내용은 이용 약관을 참조하세요.