OPEN-SOURCE SCRIPT
Altcoins vs BTC Market Cap Heatmap

Altcoins vs BTC Market Cap Heatmap
"Ground control to major Tom" 🌙 👨🚀 🚀
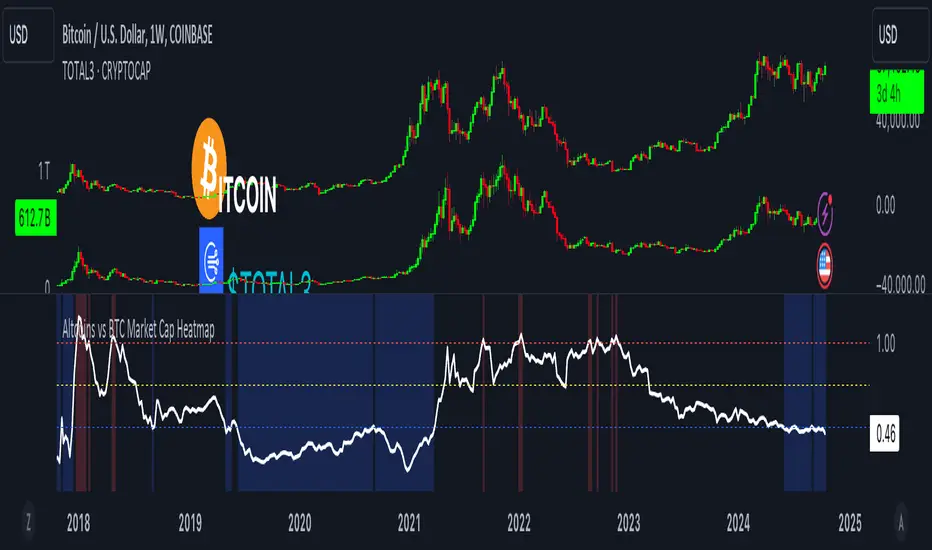
This indicator provides a visual heatmap for tracking the relationship between the market cap of altcoins (TOTAL3) and Bitcoin (BTC). The primary goal is to identify potential market cycle tops and bottoms by analyzing how the TOTAL3 market cap (all cryptocurrencies excluding Bitcoin and Ethereum) compares to Bitcoin’s market cap.
Key Features:
• Market Cap Ratio: Plots the ratio of TOTAL3 to BTC market caps to give a clear visual representation of altcoin strength versus Bitcoin.
• Heatmap: Colors the background red when altcoins are overheating (TOTAL3 market cap equals or exceeds BTC) and blue when altcoins are cooling (TOTAL3 market cap is half or less than BTC).
• Threshold Levels: Includes horizontal lines at 1 (Overheated), 0.75 (Median), and 0.5 (Cooling) for easy reference.
• Alerts: Set alert conditions for when the ratio crosses key levels (1.0, 0.75, and 0.5), enabling timely notifications for potential market shifts.
How It Works:
• Overheated (Ratio ≥ 1): Indicates that the altcoin market cap is on par or larger than Bitcoin's, which could signal a top in the cycle.
• Cooling (Ratio < 0.5): Suggests that the altcoin market cap is half or less than Bitcoin's, potentially signaling a market bottom or cooling phase.
• Median (Ratio ≈ 0.75): A midpoint that provides insight into the market's neutral zone.
Use this tool to monitor market extremes and adjust your strategy accordingly when the altcoin market enters overheated or cooling phases.
오픈 소스 스크립트
트레이딩뷰의 진정한 정신에 따라, 이 스크립트의 작성자는 이를 오픈소스로 공개하여 트레이더들이 기능을 검토하고 검증할 수 있도록 했습니다. 작성자에게 찬사를 보냅니다! 이 코드는 무료로 사용할 수 있지만, 코드를 재게시하는 경우 하우스 룰이 적용된다는 점을 기억하세요.
면책사항
해당 정보와 게시물은 금융, 투자, 트레이딩 또는 기타 유형의 조언이나 권장 사항으로 간주되지 않으며, 트레이딩뷰에서 제공하거나 보증하는 것이 아닙니다. 자세한 내용은 이용 약관을 참조하세요.
오픈 소스 스크립트
트레이딩뷰의 진정한 정신에 따라, 이 스크립트의 작성자는 이를 오픈소스로 공개하여 트레이더들이 기능을 검토하고 검증할 수 있도록 했습니다. 작성자에게 찬사를 보냅니다! 이 코드는 무료로 사용할 수 있지만, 코드를 재게시하는 경우 하우스 룰이 적용된다는 점을 기억하세요.
면책사항
해당 정보와 게시물은 금융, 투자, 트레이딩 또는 기타 유형의 조언이나 권장 사항으로 간주되지 않으며, 트레이딩뷰에서 제공하거나 보증하는 것이 아닙니다. 자세한 내용은 이용 약관을 참조하세요.