INVITE-ONLY SCRIPT
WaveTrend Anomaly by Hypester
As requested by the Alpha community, here's our release.
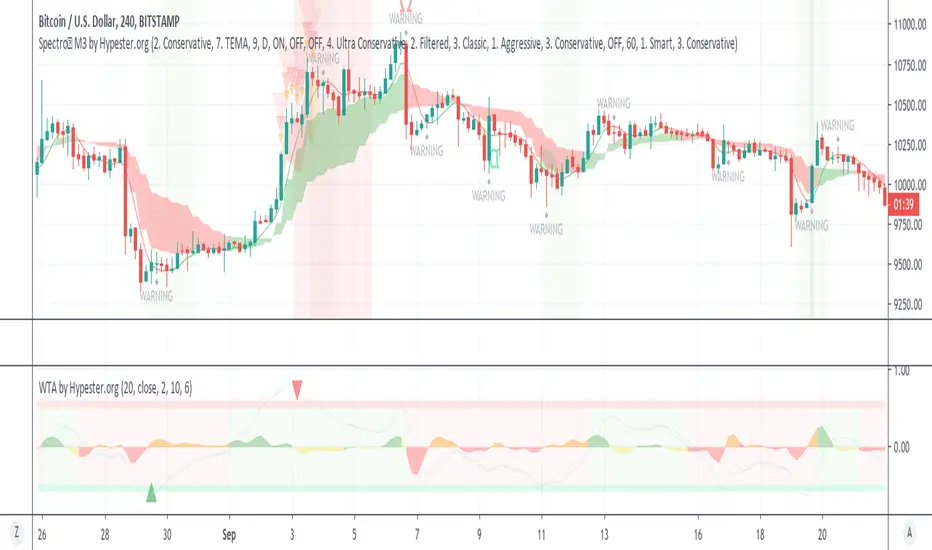
This is a different type of Wavetrend indicator; here, we have a statistical approach to the waves. We normalize the trends as a reference to measure how much every move differs from the average.
If the move is too far out, it tends to go back to the average as a rule. This indicator yields a %. As you can see, most of the moves tend to stay within 0.5 and -0.5. Remember the fact that 0.5 means 50%, the negative factor here only determines direction.
Funny the fact that most crossings happen within the 0.5 and -0.5, which means they occur before the odds are against them all the time. That highlights the chaotic nature of the markets.
However, the outliers, the moves that extrapolate the 50%, tend to go back to the average quickly, and the big triangles highlight this crossing.
You can also display every single crossing and its direction in the options panel.
There're more customization capabilities in the panel, too, like length, source, and so on.
Now to the background color options, when it's green, we have a confirmed bull movement, and red is a confirmed bear.
The area oscillator is the slope between the fast and slow oscillator lines. Here you can see when the trend is reversing or losing its strength. The orange slope color happens when you have a bearish trend, for instance. The yellow slope happens with a bull trend but a negative momentum. By mixing the colors, you can evaluate if it's strong enough for a full reversal and so on.
This same approach could be handy to spot bottoms and tops.
초대 전용 스크립트
이 스크립트는 작성자가 승인한 사용자만 접근할 수 있습니다. 사용하려면 요청 후 승인을 받아야 하며, 일반적으로 결제 후에 허가가 부여됩니다. 자세한 내용은 아래 작성자의 안내를 따르거나 spectertrading에게 직접 문의하세요.
트레이딩뷰는 스크립트의 작동 방식을 충분히 이해하고 작성자를 완전히 신뢰하지 않는 이상, 해당 스크립트에 비용을 지불하거나 사용하는 것을 권장하지 않습니다. 커뮤니티 스크립트에서 무료 오픈소스 대안을 찾아보실 수도 있습니다.
작성자 지시 사항
면책사항
해당 정보와 게시물은 금융, 투자, 트레이딩 또는 기타 유형의 조언이나 권장 사항으로 간주되지 않으며, 트레이딩뷰에서 제공하거나 보증하는 것이 아닙니다. 자세한 내용은 이용 약관을 참조하세요.