OPEN-SOURCE SCRIPT
업데이트됨 Expected Z-Scored Price
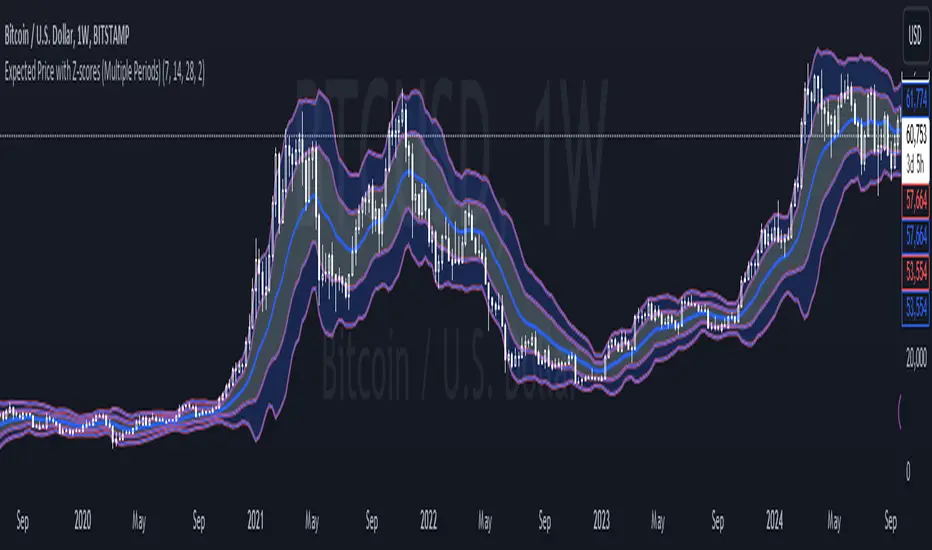
Expected Z-Scored Price is a Mean Reversion based indicator, it shows you where the price should be based on its average price and its average increase over the set previous period, indicating whether the price is under/overvalued giving a unique insight into the current value of an asset, for example  BTCUSD , however is designed for all assets that move in price.
How to read the Expected Z-scored price?
1. Zoom closer, you will see a line in the middle, this is where the price should be based on its average price and its movement
2. The lines above/below are the Standard Deviations (SD) of this expected price, if the price is in the lower price bands or even below them, it is undervalued and it is time to buy/accumulate it, if the price is above the mean (average) price, it is undervalued and should be sold.
It is that easy!
!WATCH OUT!
- This is not a Trend Following indicator, it does not indicate the prices direction, therefore if the asset is undervalued it can still go down, the bands indicate the significancy of the under/overvalueness
- It is not 100% accurate
- Watch out for the significancy of the undervalue or overvalue
Bit more info
- Each line is one SD away from the mean
- Adjusting the timeframe will help you keep the mean and its SDs on the signal period you want them to
- You can adjust the color, thickness of the lines and bands in settings
릴리즈 노트
NEW MINI UPDATE!Now one of components of Expected price Z-score is an average of 3 periods, that will be adjustable
오픈 소스 스크립트
진정한 트레이딩뷰 정신에 따라 이 스크립트 작성자는 트레이더가 기능을 검토하고 검증할 수 있도록 오픈소스로 공개했습니다. 작성자에게 찬사를 보냅니다! 무료로 사용할 수 있지만 코드를 다시 게시할 경우 하우스 룰이 적용된다는 점을 기억하세요.
면책사항
이 정보와 게시물은 TradingView에서 제공하거나 보증하는 금융, 투자, 거래 또는 기타 유형의 조언이나 권고 사항을 의미하거나 구성하지 않습니다. 자세한 내용은 이용 약관을 참고하세요.
오픈 소스 스크립트
진정한 트레이딩뷰 정신에 따라 이 스크립트 작성자는 트레이더가 기능을 검토하고 검증할 수 있도록 오픈소스로 공개했습니다. 작성자에게 찬사를 보냅니다! 무료로 사용할 수 있지만 코드를 다시 게시할 경우 하우스 룰이 적용된다는 점을 기억하세요.
면책사항
이 정보와 게시물은 TradingView에서 제공하거나 보증하는 금융, 투자, 거래 또는 기타 유형의 조언이나 권고 사항을 의미하거나 구성하지 않습니다. 자세한 내용은 이용 약관을 참고하세요.