OPEN-SOURCE SCRIPT
업데이트됨 Fixed Fibonacci Support Resistance
I took the formula of the fibonacci from LonesomeTheBlue and made this script. You can take a look at his indicator here: 
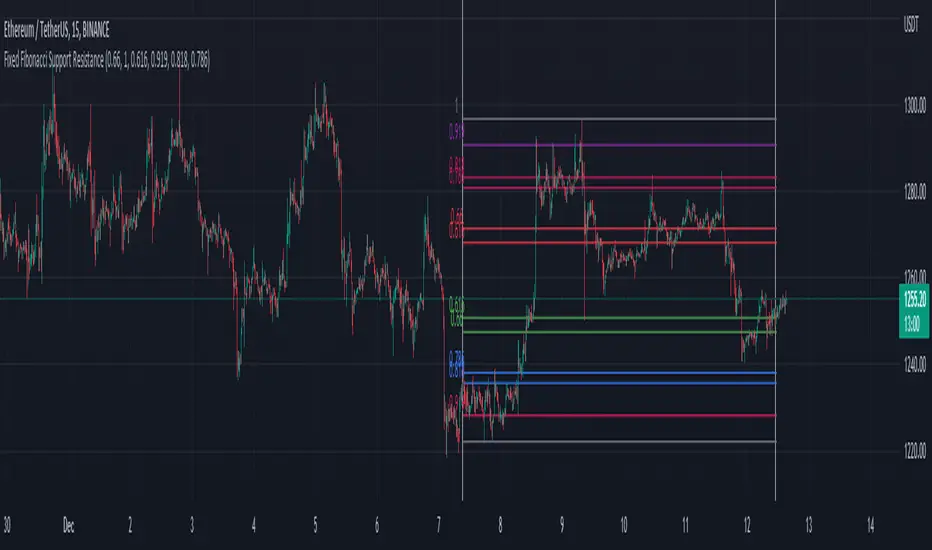
When you first add the indicator on the chart, click on the chart to select the first date and then the second date. It will then calculate the fibonacci support and resistance of the range you choose. You can also choose the date inside the inputs.
Be sure the first date is before the second date, otherwise it won't be able to show the fibonacci. If that happen, choose a correct date in the inputs.
릴리즈 노트
The original code is from LonesomeTheBlue in the Fibonacci Levels MTF script.릴리즈 노트
-Added a bool to extend the fibonacci to the right. -I changed the fibonacci to start from start time to end time instead of starting at end time.
-Added a bool to show/hide the start/end white line.
오픈 소스 스크립트
트레이딩뷰의 진정한 정신에 따라, 이 스크립트의 작성자는 이를 오픈소스로 공개하여 트레이더들이 기능을 검토하고 검증할 수 있도록 했습니다. 작성자에게 찬사를 보냅니다! 이 코드는 무료로 사용할 수 있지만, 코드를 재게시하는 경우 하우스 룰이 적용된다는 점을 기억하세요.
면책사항
해당 정보와 게시물은 금융, 투자, 트레이딩 또는 기타 유형의 조언이나 권장 사항으로 간주되지 않으며, 트레이딩뷰에서 제공하거나 보증하는 것이 아닙니다. 자세한 내용은 이용 약관을 참조하세요.
오픈 소스 스크립트
트레이딩뷰의 진정한 정신에 따라, 이 스크립트의 작성자는 이를 오픈소스로 공개하여 트레이더들이 기능을 검토하고 검증할 수 있도록 했습니다. 작성자에게 찬사를 보냅니다! 이 코드는 무료로 사용할 수 있지만, 코드를 재게시하는 경우 하우스 룰이 적용된다는 점을 기억하세요.
면책사항
해당 정보와 게시물은 금융, 투자, 트레이딩 또는 기타 유형의 조언이나 권장 사항으로 간주되지 않으며, 트레이딩뷰에서 제공하거나 보증하는 것이 아닙니다. 자세한 내용은 이용 약관을 참조하세요.