INVITE-ONLY SCRIPT
업데이트됨 MAPS - HiLo Divergence
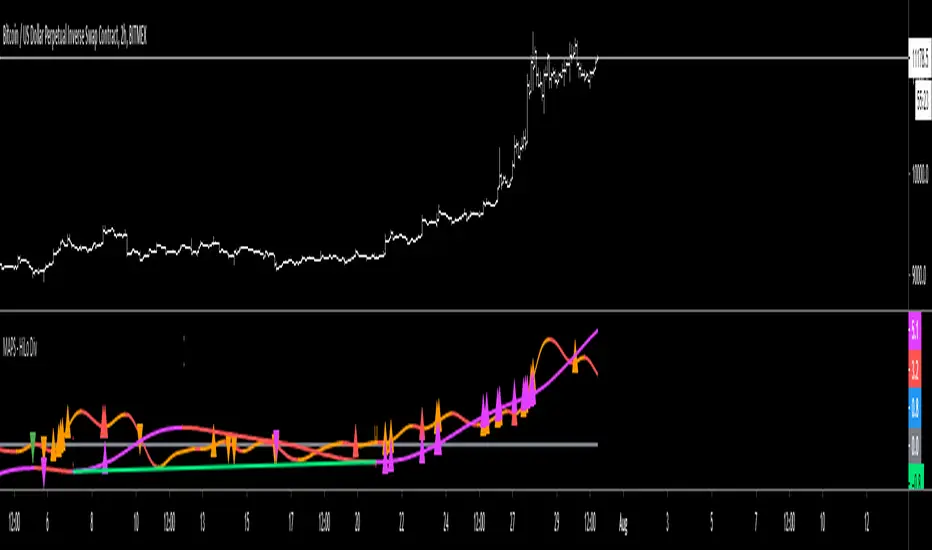
The High/Low indicator utilizes the measuring of local highs and lows as well as local peaks and troughs to identify possible divergence in the price action.
Purple oscillator = Higher Timeframe's price measurement
Purple high triangle = A local high on the higher timeframe has been made
Purple low triangle = A local low on the higher timeframe has been made
Red high triangle on the purple oscillator = A local high on the higher timeframe has been made and is deemed a bearish divergent high
Green low triangle on the purple oscillator = A local low on the higher timeframe has been made and is deemed a bullish divergent low
Orange oscillator = Current Timeframe's price measurement
Orange high triangle = A local high on the current timeframe has been made
Orange low triangle = A local low on the current timeframe has been made
Red high triangle on the orange oscillator = A local high on the current timeframe has been made and is deemed a bearish divergent high
Green low triangle on the orange oscillator = A local low on the current timeframe has been made and is deemed a bullish divergent low
릴리즈 노트
Updated colors to show red when oscillators are moving downwards.초대 전용 스크립트
이 스크립트는 작성자가 승인한 사용자만 접근할 수 있습니다. 사용하려면 요청 후 승인을 받아야 하며, 일반적으로 결제 후에 허가가 부여됩니다. 자세한 내용은 아래 작성자의 안내를 따르거나 TheTimeCount에게 직접 문의하세요.
트레이딩뷰는 스크립트의 작동 방식을 충분히 이해하고 작성자를 완전히 신뢰하지 않는 이상, 해당 스크립트에 비용을 지불하거나 사용하는 것을 권장하지 않습니다. 커뮤니티 스크립트에서 무료 오픈소스 대안을 찾아보실 수도 있습니다.
작성자 지시 사항
DM me for access to the private indicators twitter.com/TheTimeCount
면책사항
해당 정보와 게시물은 금융, 투자, 트레이딩 또는 기타 유형의 조언이나 권장 사항으로 간주되지 않으며, 트레이딩뷰에서 제공하거나 보증하는 것이 아닙니다. 자세한 내용은 이용 약관을 참조하세요.
초대 전용 스크립트
이 스크립트는 작성자가 승인한 사용자만 접근할 수 있습니다. 사용하려면 요청 후 승인을 받아야 하며, 일반적으로 결제 후에 허가가 부여됩니다. 자세한 내용은 아래 작성자의 안내를 따르거나 TheTimeCount에게 직접 문의하세요.
트레이딩뷰는 스크립트의 작동 방식을 충분히 이해하고 작성자를 완전히 신뢰하지 않는 이상, 해당 스크립트에 비용을 지불하거나 사용하는 것을 권장하지 않습니다. 커뮤니티 스크립트에서 무료 오픈소스 대안을 찾아보실 수도 있습니다.
작성자 지시 사항
DM me for access to the private indicators twitter.com/TheTimeCount
면책사항
해당 정보와 게시물은 금융, 투자, 트레이딩 또는 기타 유형의 조언이나 권장 사항으로 간주되지 않으며, 트레이딩뷰에서 제공하거나 보증하는 것이 아닙니다. 자세한 내용은 이용 약관을 참조하세요.