OPEN-SOURCE SCRIPT
Money Flow based probability
Money Flow based probability
This indicator provides a comprehensive correlation and momentum analysis between your main asset and up to three selected correlated assets. It combines correlation, trend, momentum, and overbought/oversold signals into a single, easy-to-read table directly on your chart.
This indicator is ideal for traders who want to quickly assess the influence of major correlated markets and technical signals on their trading instrument, all in a single glance.
---
Example: Correlation Calculation
Pine Script®
Example: Table Output (Buy/Sell %)
Pine Script®
This indicator provides a comprehensive correlation and momentum analysis between your main asset and up to three selected correlated assets. It combines correlation, trend, momentum, and overbought/oversold signals into a single, easy-to-read table directly on your chart.
- Correlated Asset Selection:
You can select up to three correlated assets (e.g., indices, currencies, bonds) to compare with your main chart symbol. Each asset can be toggled on or off. - Correlation Calculation:
The indicator uses the native Pine Scriptfunction to measure the statistical relationship between the closing prices of your asset and each selected pair over a user-defined period.Pine Script® ta.correlation - Technical Analysis Integration:
For each asset (including the main one), the indicator calculates:
Trend direction using EMA (Exponential Moving Average) – optional
Momentum using MACD – optional
Overbought/oversold status using RSI – optional - Probability Scoring:
A weighted scoring system combines correlation, trend, MACD, RSI, and trend exhaustion signals to produce buy and sell probabilities for the main asset. - Visual Table Output:
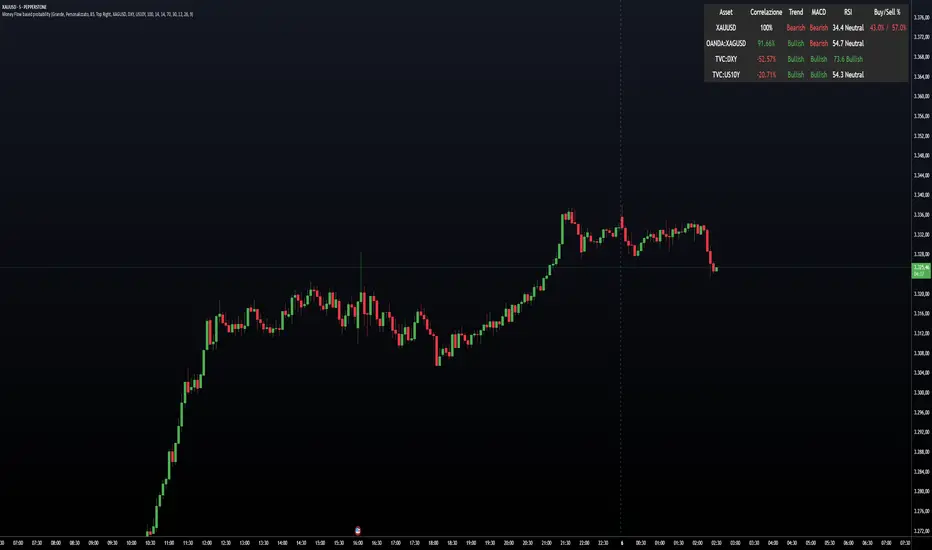
A customizable table is displayed on the chart, showing:
Asset name
Correlation (as a percentage, -100% to +100%)
Trend (Bullish/Bearish)
MACD status (Bullish/Bearish)
RSI value and status
Buy/Sell probability (with fixed-width formatting for stability) - User Customization:
You can adjust:- Table size, color, and position
- Correlation period
- EMA, MACD, and RSI parameters
- Which assets to display
- Table size, color, and position
This indicator is ideal for traders who want to quickly assess the influence of major correlated markets and technical signals on their trading instrument, all in a single glance.
---
Example: Correlation Calculation
corrCurrentAsset1 = ta.correlation(close, asset1Data, correlationPeriod)
Example: Table Output (Buy/Sell %)
buyStr = f_formatPercent(buyProbability) + "%"
sellStr = f_formatPercent(sellProbability) + "%"
cellStr = buyStr + " / " + sellStr
오픈 소스 스크립트
트레이딩뷰의 진정한 정신에 따라, 이 스크립트의 작성자는 이를 오픈소스로 공개하여 트레이더들이 기능을 검토하고 검증할 수 있도록 했습니다. 작성자에게 찬사를 보냅니다! 이 코드는 무료로 사용할 수 있지만, 코드를 재게시하는 경우 하우스 룰이 적용된다는 점을 기억하세요.
면책사항
해당 정보와 게시물은 금융, 투자, 트레이딩 또는 기타 유형의 조언이나 권장 사항으로 간주되지 않으며, 트레이딩뷰에서 제공하거나 보증하는 것이 아닙니다. 자세한 내용은 이용 약관을 참조하세요.
오픈 소스 스크립트
트레이딩뷰의 진정한 정신에 따라, 이 스크립트의 작성자는 이를 오픈소스로 공개하여 트레이더들이 기능을 검토하고 검증할 수 있도록 했습니다. 작성자에게 찬사를 보냅니다! 이 코드는 무료로 사용할 수 있지만, 코드를 재게시하는 경우 하우스 룰이 적용된다는 점을 기억하세요.
면책사항
해당 정보와 게시물은 금융, 투자, 트레이딩 또는 기타 유형의 조언이나 권장 사항으로 간주되지 않으며, 트레이딩뷰에서 제공하거나 보증하는 것이 아닙니다. 자세한 내용은 이용 약관을 참조하세요.