OPEN-SOURCE SCRIPT
AlexD Market annual seasonality
업데이트됨

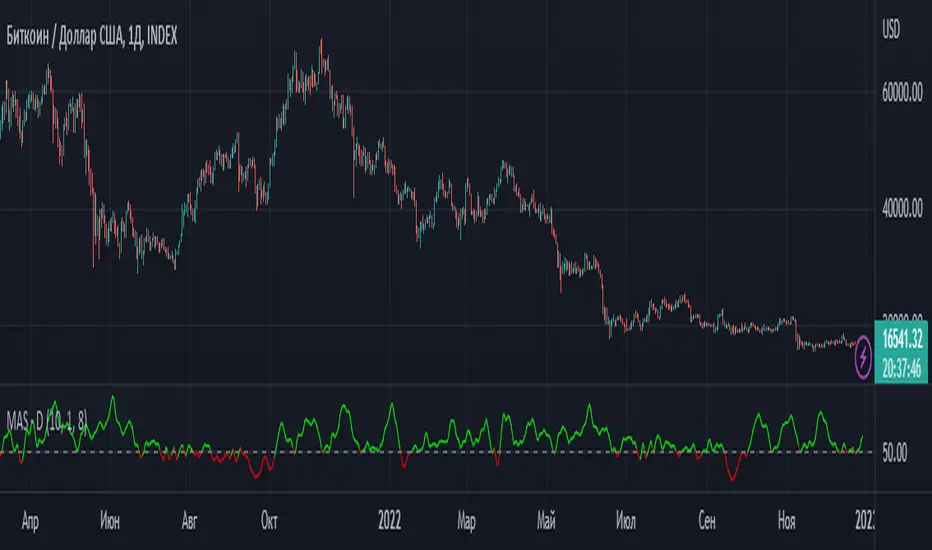
The indicator displays the percentage of bullish days with a given date over several years.
This allows you to determine the days of the year when the price usually goes up or down.
Indicator has a built-in "simple moving average" shifted back by half a period, due to which the delay of this smoothing is removed.
This allows you to determine the days of the year when the price usually goes up or down.
Indicator has a built-in "simple moving average" shifted back by half a period, due to which the delay of this smoothing is removed.
릴리즈 노트
Offset removed from plot() function릴리즈 노트
Added smoothing when sampling the day of the year.The "Depth" property indicates how many bars to take for smoothing to the left and right of the found day.
Extreme bars are taken with less weighting for smooth signal decay.
I recommend setting "Depth" to 1. If you don't need to use this feature, set "Depth" to 0.
This is the final functionality change. Further changes are possible to optimize the indicator.
오픈 소스 스크립트
진정한 TradingView 정신에 따라, 이 스크립트의 저자는 트레이더들이 이해하고 검증할 수 있도록 오픈 소스로 공개했습니다. 저자에게 박수를 보냅니다! 이 코드는 무료로 사용할 수 있지만, 출판물에서 이 코드를 재사용하는 것은 하우스 룰에 의해 관리됩니다. 님은 즐겨찾기로 이 스크립트를 차트에서 쓸 수 있습니다.
차트에 이 스크립트를 사용하시겠습니까?
면책사항
이 정보와 게시물은 TradingView에서 제공하거나 보증하는 금융, 투자, 거래 또는 기타 유형의 조언이나 권고 사항을 의미하거나 구성하지 않습니다. 자세한 내용은 이용 약관을 참고하세요.