OPEN-SOURCE SCRIPT
업데이트됨 Volume Data Customized Timeframe
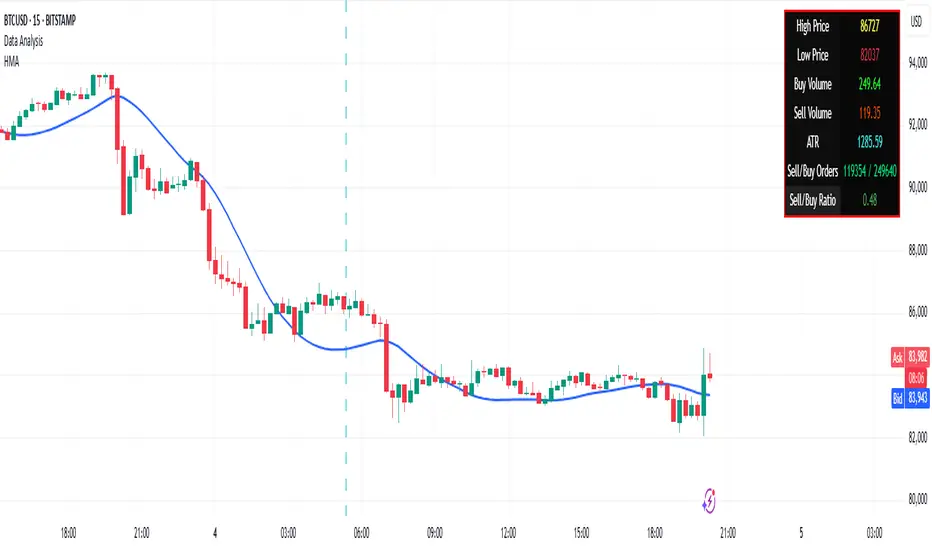
The "Volume Data Customized Timeframe" (VolData CTF) indicator provides traders with an enhanced volume analysis tool that aggregates buy and sell volume over a user-defined timeframe. It enables a comparative assessment of bullish and bearish volume trends, offering deeper insights into market sentiment. The indicator features a customizable display table with user-selectable themes and positioning, providing essential volume metrics for improved trading decisions.
1. Introduction:
The "Volume Data Customized Timeframe" indicator is designed to help traders analyze volume trends across different timeframes. It allows users to customize the period for volume calculations, view the ratio of selling to buying volume, and present the data in a user-friendly table format.
2. Features:
Selectable timeframe for volume analysis (default: chart timeframe)
Calculation of bullish (buy) and bearish (sell) volume
Customizable table size, theme, and positioning
Displays key volume metrics:
Total Buy Volume
Total Sell Volume
Sell/Buy Volume Ratio
Analysis period in minutes, days, weeks, or months
3. Indicator Inputs:
Average Volume Lookback (n): Number of bars used to calculate volume statistics.
Select Timeframe: Custom timeframe for volume calculations (leave empty to use the chart's timeframe).
Table Size: Choose from Small, Medium, or Big to adjust text size.
Table Theme: Choose between Light and Dark themes.
Table Position: Place the table in any corner of the chart (top-left, top-right, bottom-left, bottom-right).
4. How It Works:
The indicator retrieves volume data for the selected timeframe.
It aggregates bullish and bearish volume based on the lookback period.
The sell-to-buy volume ratio is calculated and color-coded (green for bullish dominance, red for bearish dominance).
The volume statistics are displayed in a customizable table for easy reference.
5. Interpretation:
Δ BUY VOL: Represents the total volume of bullish (up-closing) bars within the lookback period.
Δ SELL VOL: Represents the total volume of bearish (down-closing) bars within the lookback period.
Δ SELL/Δ BUY: The ratio of bearish to bullish volume; values above 1 indicate more selling pressure, while values below 1 indicate buying dominance.
Period (M/D/W/M): Displays the selected timeframe for volume aggregation.
릴리즈 노트
✅ Accounts for partial buying and selling in each candle✅ Doesn’t assume entire volume belongs to buyers/sellers
✅ More accurate approximation of buy/sell volume
릴리즈 노트
✅ Accounts for partial buying and selling in each candle✅ Doesn’t assume entire volume belongs to buyers/sellers
✅ More accurate approximation of buy/sell volume
릴리즈 노트
The script will always use standard OHLC candles, no matter what chart type you're using! 🚀Modifications made if division by '0'
릴리즈 노트
small fix릴리즈 노트
Added Orders detailfine tuned ATR
sell/buy Ratio
오픈 소스 스크립트
트레이딩뷰의 진정한 정신에 따라, 이 스크립트의 작성자는 이를 오픈소스로 공개하여 트레이더들이 기능을 검토하고 검증할 수 있도록 했습니다. 작성자에게 찬사를 보냅니다! 이 코드는 무료로 사용할 수 있지만, 코드를 재게시하는 경우 하우스 룰이 적용된다는 점을 기억하세요.
면책사항
해당 정보와 게시물은 금융, 투자, 트레이딩 또는 기타 유형의 조언이나 권장 사항으로 간주되지 않으며, 트레이딩뷰에서 제공하거나 보증하는 것이 아닙니다. 자세한 내용은 이용 약관을 참조하세요.
오픈 소스 스크립트
트레이딩뷰의 진정한 정신에 따라, 이 스크립트의 작성자는 이를 오픈소스로 공개하여 트레이더들이 기능을 검토하고 검증할 수 있도록 했습니다. 작성자에게 찬사를 보냅니다! 이 코드는 무료로 사용할 수 있지만, 코드를 재게시하는 경우 하우스 룰이 적용된다는 점을 기억하세요.
면책사항
해당 정보와 게시물은 금융, 투자, 트레이딩 또는 기타 유형의 조언이나 권장 사항으로 간주되지 않으며, 트레이딩뷰에서 제공하거나 보증하는 것이 아닙니다. 자세한 내용은 이용 약관을 참조하세요.