INVITE-ONLY SCRIPT
업데이트됨 TM_DAY_TRACKER_SUPER
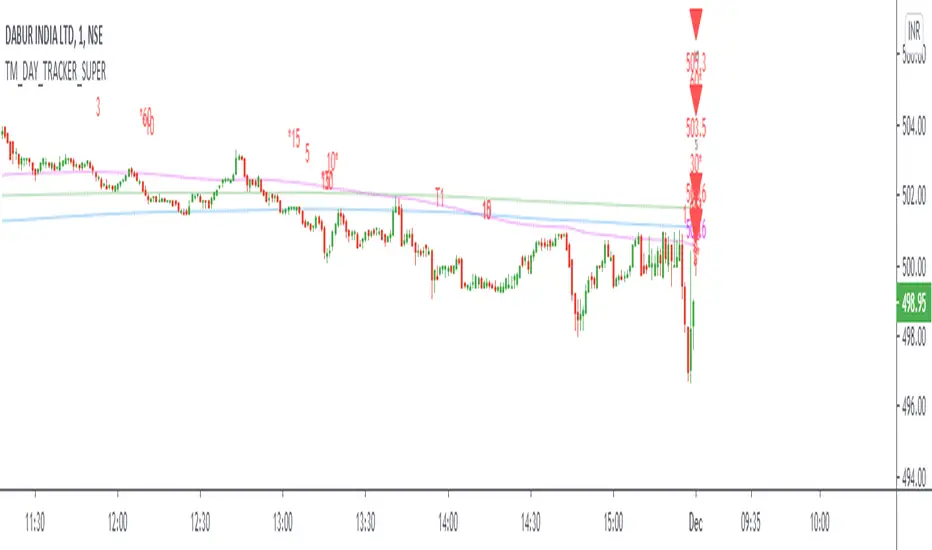
Day_Tracker_Super Indicator shows overall trend or market direction for Intraday / Swing Position along with Buy or sell signal.
Terminology Use ==> B- Buy, S- Sale Signal, and Numbers are to show time frame indication there is presence of buyer or seller like B1 for buy signal on 1 minute time frame etc.
Display and Interpretation ==> Buy Sale Signal in B/S , Digit with 1-3-5-10-15-30-60-D for different time frames, Value with Triangle mark shows possible direction of momentum
This indicator help to identify 4 major things:-
1. Area of order Buildup
2. Price Strength
3. Direction
4. Volatility
There are 3 Line in trend chart
Green for positive trend, red for negative trend
line change color based on trend change
least dark "Green/Red" shows main trend and work as major trend line". It describe which side market will take momentum and whenever price come to this area, very important for position build up either long side or short side"
light dark "Green/Red" work as primary support / resistance and area of value. During the price movement price takes support or resistance here and bounce back or reverse back"
most dark "blue/purple" work as volatility line . This is area of volatility and direction to main trend. Price crossing above or below will give huge direction movement
==> 2 line in common color "Green/Red" shows main trend
Use market structure, chart pattern, trend lines for more support..
There is 1 dot in chart, This dot show accumulation or distribution price, Green / Red line shows market strength. Signal with 1-3-5-10-15-30-60-D shows active order position over time frame and 1 with Price Value like show area of momentum or volatility . Signal on higher the time frame , more strong momentum
Time frame ==> Use proper Signal with swing trend on 1 minute, 3 minute 5 minute, 15 minute time frame
What to Identify ==> Overall Trend for the intraday and swing Period
How to Use ==>
See how and order buildup is seen and current order position. Also area for volatility and expected movement in price direction
Note: - Use market structure, chart pattern, trend lines and price action parameter for more confirmation.
Entry ==>
Let’s wait the proper area of support or resistance ( Area of Value in case of trend pattern use)
Exit ==>
SL of swing high/low out of market structure with proper risk management and target with proper Risk/ Reward Ratio
Use the Below Contacts to Access this Indicator
릴리즈 노트
Update in Line Thickness릴리즈 노트
Update Closing Value릴리즈 노트
Update in Data Value릴리즈 노트
Updates릴리즈 노트
updates릴리즈 노트
update릴리즈 노트
Updates릴리즈 노트
Update릴리즈 노트
Updates초대 전용 스크립트
이 스크립트는 작성자가 승인한 사용자만 접근할 수 있습니다. 사용하려면 요청 후 승인을 받아야 하며, 일반적으로 결제 후에 허가가 부여됩니다. 자세한 내용은 아래 작성자의 안내를 따르거나 TradingMind24에게 직접 문의하세요.
트레이딩뷰는 스크립트의 작동 방식을 충분히 이해하고 작성자를 완전히 신뢰하지 않는 이상, 해당 스크립트에 비용을 지불하거나 사용하는 것을 권장하지 않습니다. 커뮤니티 스크립트에서 무료 오픈소스 대안을 찾아보실 수도 있습니다.
작성자 지시 사항
면책사항
해당 정보와 게시물은 금융, 투자, 트레이딩 또는 기타 유형의 조언이나 권장 사항으로 간주되지 않으며, 트레이딩뷰에서 제공하거나 보증하는 것이 아닙니다. 자세한 내용은 이용 약관을 참조하세요.
초대 전용 스크립트
이 스크립트는 작성자가 승인한 사용자만 접근할 수 있습니다. 사용하려면 요청 후 승인을 받아야 하며, 일반적으로 결제 후에 허가가 부여됩니다. 자세한 내용은 아래 작성자의 안내를 따르거나 TradingMind24에게 직접 문의하세요.
트레이딩뷰는 스크립트의 작동 방식을 충분히 이해하고 작성자를 완전히 신뢰하지 않는 이상, 해당 스크립트에 비용을 지불하거나 사용하는 것을 권장하지 않습니다. 커뮤니티 스크립트에서 무료 오픈소스 대안을 찾아보실 수도 있습니다.
작성자 지시 사항
면책사항
해당 정보와 게시물은 금융, 투자, 트레이딩 또는 기타 유형의 조언이나 권장 사항으로 간주되지 않으며, 트레이딩뷰에서 제공하거나 보증하는 것이 아닙니다. 자세한 내용은 이용 약관을 참조하세요.