OPEN-SOURCE SCRIPT
Enhanced Market Influence Dashboard
Description
The "Enhanced Market Influence Dashboard" (EMID) is a sophisticated trading indicator developed in Pine Script, designed to provide traders with a comprehensive view of the market's influences by analyzing a diverse set of financial instruments. This script integrates various market data, calculates dynamic weights based on volatility, and combines them into a composite score to help traders identify significant market movements.
Concept and Methodology
The EMID indicator aggregates data from multiple financial instruments, including forex pairs, commodities, indices, and ETFs. By calculating the median and volatility of these instruments over user-defined timelines, it dynamically adjusts their weights to reflect current market conditions. The composite score generated from these weighted values helps traders understand the overall market influence and detect significant movements.
Key Features
Market Data Integration: The script fetches real-time data from various symbols such as USD/JPY, Gold, Dollar Index (DXY), US Treasury Rate, VIX Index, Crude Oil, EUR/USD, Emerging Market Index, QYLD ETF, and Nasdaq 100 Futures.
1. Dynamic Weight Calculation: The script calculates dynamic weights for each instrument based on their volatility relative to their simple moving average. This approach ensures that more volatile instruments have a proportionally higher impact on the composite score.
2. Median and Volatility Analysis: It uses the median value and standard deviation over specified timelines to gauge the central tendency and volatility of each instrument.
3. Composite Score Generation: By normalizing the difference between current prices and their respective medians, and applying dynamic weights, the script generates a composite score that reflects the overall market sentiment.
4. Baseline Calculation: A dynamic baseline is computed as the median of the composite score over the lookback period, providing a reference point for identifying significant deviations.
5. Alerts: The script includes alert conditions to notify traders of significant market movements, either above or below the baseline by a threshold value.
Usage
To use the EMID indicator, follow these steps:
1. Input Configuration: Adjust the input parameters to suit your trading strategy. The key inputs include:
-Median Timeline: The period for calculating the median values.
-Volatility Timeline: The period for calculating volatility.
-Base Weights: Set the base weights for each financial instrument according to their perceived influence on the market.
-Adding the Indicator: Apply the EMID indicator to your chart in TradingView. Ensure that the symbols used in the script are relevant to your trading strategy and available in your TradingView subscription.
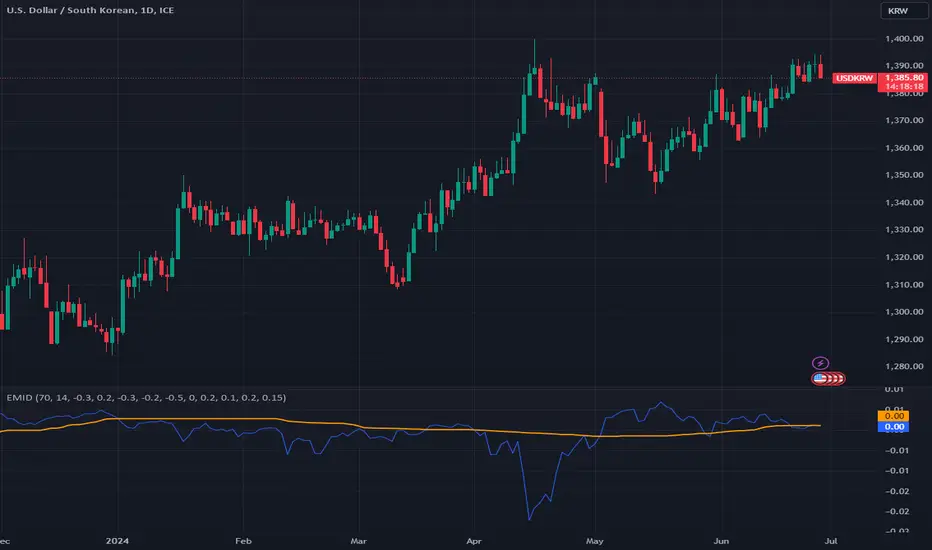
2. Interpreting the Composite Score: The composite score plotted on the chart gives an aggregated view of market influences. Compare the composite score with the baseline to identify significant market movements.
-A composite score significantly above the baseline indicates a potential market uptrend.
-A composite score significantly below the baseline indicates a potential market downtrend.
-Setting Alerts: Use the alert conditions to set up notifications for significant market movements. These alerts help you stay informed about critical changes in market sentiment.
Underlying Calculations
1. Median Calculation: The median function is applied to each instrument's price data over the specified timeline.
2. Volatility Calculation: Volatility is calculated as the standard deviation divided by the simple moving average over the volatility timeline.
3. Dynamic Weight Application: Base weights are multiplied by the respective volatility values to get dynamic weights.
4. Normalized Scores: The script normalizes the difference between current prices and their medians, then multiplies by the dynamic weights to get individual scores.
5. Composite Score: Summing all normalized and weighted scores results in the composite score.
6. Baseline: The baseline is the median of the composite score over the median timeline.
By integrating multiple market influences and dynamically adjusting weights based on volatility, the EMID indicator provides a robust tool for traders to analyze market conditions and make informed trading decisions.
The "Enhanced Market Influence Dashboard" (EMID) is a sophisticated trading indicator developed in Pine Script, designed to provide traders with a comprehensive view of the market's influences by analyzing a diverse set of financial instruments. This script integrates various market data, calculates dynamic weights based on volatility, and combines them into a composite score to help traders identify significant market movements.
Concept and Methodology
The EMID indicator aggregates data from multiple financial instruments, including forex pairs, commodities, indices, and ETFs. By calculating the median and volatility of these instruments over user-defined timelines, it dynamically adjusts their weights to reflect current market conditions. The composite score generated from these weighted values helps traders understand the overall market influence and detect significant movements.
Key Features
Market Data Integration: The script fetches real-time data from various symbols such as USD/JPY, Gold, Dollar Index (DXY), US Treasury Rate, VIX Index, Crude Oil, EUR/USD, Emerging Market Index, QYLD ETF, and Nasdaq 100 Futures.
1. Dynamic Weight Calculation: The script calculates dynamic weights for each instrument based on their volatility relative to their simple moving average. This approach ensures that more volatile instruments have a proportionally higher impact on the composite score.
2. Median and Volatility Analysis: It uses the median value and standard deviation over specified timelines to gauge the central tendency and volatility of each instrument.
3. Composite Score Generation: By normalizing the difference between current prices and their respective medians, and applying dynamic weights, the script generates a composite score that reflects the overall market sentiment.
4. Baseline Calculation: A dynamic baseline is computed as the median of the composite score over the lookback period, providing a reference point for identifying significant deviations.
5. Alerts: The script includes alert conditions to notify traders of significant market movements, either above or below the baseline by a threshold value.
Usage
To use the EMID indicator, follow these steps:
1. Input Configuration: Adjust the input parameters to suit your trading strategy. The key inputs include:
-Median Timeline: The period for calculating the median values.
-Volatility Timeline: The period for calculating volatility.
-Base Weights: Set the base weights for each financial instrument according to their perceived influence on the market.
-Adding the Indicator: Apply the EMID indicator to your chart in TradingView. Ensure that the symbols used in the script are relevant to your trading strategy and available in your TradingView subscription.
2. Interpreting the Composite Score: The composite score plotted on the chart gives an aggregated view of market influences. Compare the composite score with the baseline to identify significant market movements.
-A composite score significantly above the baseline indicates a potential market uptrend.
-A composite score significantly below the baseline indicates a potential market downtrend.
-Setting Alerts: Use the alert conditions to set up notifications for significant market movements. These alerts help you stay informed about critical changes in market sentiment.
Underlying Calculations
1. Median Calculation: The median function is applied to each instrument's price data over the specified timeline.
2. Volatility Calculation: Volatility is calculated as the standard deviation divided by the simple moving average over the volatility timeline.
3. Dynamic Weight Application: Base weights are multiplied by the respective volatility values to get dynamic weights.
4. Normalized Scores: The script normalizes the difference between current prices and their medians, then multiplies by the dynamic weights to get individual scores.
5. Composite Score: Summing all normalized and weighted scores results in the composite score.
6. Baseline: The baseline is the median of the composite score over the median timeline.
By integrating multiple market influences and dynamically adjusting weights based on volatility, the EMID indicator provides a robust tool for traders to analyze market conditions and make informed trading decisions.
오픈 소스 스크립트
트레이딩뷰의 진정한 정신에 따라, 이 스크립트의 작성자는 이를 오픈소스로 공개하여 트레이더들이 기능을 검토하고 검증할 수 있도록 했습니다. 작성자에게 찬사를 보냅니다! 이 코드는 무료로 사용할 수 있지만, 코드를 재게시하는 경우 하우스 룰이 적용된다는 점을 기억하세요.
면책사항
해당 정보와 게시물은 금융, 투자, 트레이딩 또는 기타 유형의 조언이나 권장 사항으로 간주되지 않으며, 트레이딩뷰에서 제공하거나 보증하는 것이 아닙니다. 자세한 내용은 이용 약관을 참조하세요.
오픈 소스 스크립트
트레이딩뷰의 진정한 정신에 따라, 이 스크립트의 작성자는 이를 오픈소스로 공개하여 트레이더들이 기능을 검토하고 검증할 수 있도록 했습니다. 작성자에게 찬사를 보냅니다! 이 코드는 무료로 사용할 수 있지만, 코드를 재게시하는 경우 하우스 룰이 적용된다는 점을 기억하세요.
면책사항
해당 정보와 게시물은 금융, 투자, 트레이딩 또는 기타 유형의 조언이나 권장 사항으로 간주되지 않으며, 트레이딩뷰에서 제공하거나 보증하는 것이 아닙니다. 자세한 내용은 이용 약관을 참조하세요.