OPEN-SOURCE SCRIPT
25-75 Percentile SuperTrend | Mattes
25-75 Percentile SuperTrend | Mattes
Overview
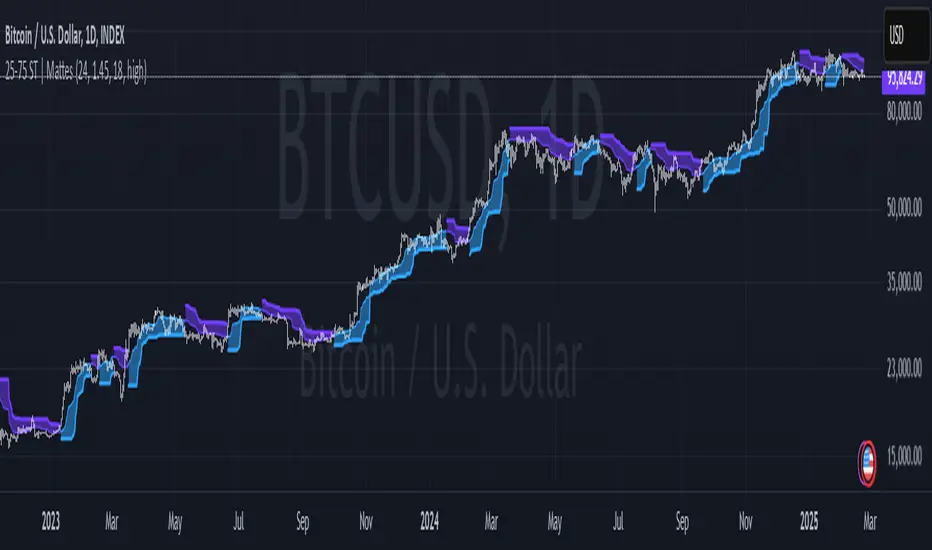
The 25-75 Percentile SuperTrend is an advanced trend-following indicator that enhances the traditional SuperTrend concept by incorporating percentile-based smoothing. Instead of using a simple moving average or median price, this indicator calculates the 25th and 75th percentiles over a user-defined period. These percentiles act as dynamic trend levels, adjusting more responsively to price volatility while reducing noise.
How It’s Calculated
Percentile Smoothing:
SuperTrend Logic:
Signal Generation:
Uses Percentiles Instead of a Moving Average:
Traditional SuperTrend relies on ATR-based offsets from a moving average.
This version replaces the moving average with percentile smoothing, which adapts better to price behavior.
Better Noise Filtering:
Since percentiles are less sensitive to outliers, this indicator reduces false signals in choppy markets.
More Adaptive to Market Conditions:
Application Examples
Risks & Disclaimers
Not a Standalone Strategy: This indicator should be used with other confirmation tools like volume analysis, momentum oscillators, or support/resistance levels.
False Signals in Sideways Markets: Although it reduces noise, choppy markets can still generate occasional false trend flips.
Market Adaptation Required: The best parameters may vary depending on the asset and timeframe.
This indicator was heavily inspired and influenced by the IRS/viResearch Median SuperTrend, improving upon its concept by transforming its median based calculation into a more responsive & effective counterpart of its former self.
Shoutout to all my Masterclass Brothers and L4 Gs!
Overview
The 25-75 Percentile SuperTrend is an advanced trend-following indicator that enhances the traditional SuperTrend concept by incorporating percentile-based smoothing. Instead of using a simple moving average or median price, this indicator calculates the 25th and 75th percentiles over a user-defined period. These percentiles act as dynamic trend levels, adjusting more responsively to price volatility while reducing noise.
How It’s Calculated
Percentile Smoothing:
- The 25th percentile of the selected source (low-end smoothing).
- The 75th percentile of the selected source (high-end smoothing).
SuperTrend Logic:
- The upper band is set at the 75th percentile + ATR multiplier.
- The lower band is set at the 25th percentile - ATR multiplier.
- The trend flips when the price crosses above/below these dynamic bands.
Signal Generation:
- A bullish trend occurs when price remains above the lower band.
- A bearish trend occurs when price remains below the upper band.
- Trend shifts are highlighted with colored bars and lines for easy visualization.
- How It Differs From Traditional SuperTrend
Uses Percentiles Instead of a Moving Average:
Traditional SuperTrend relies on ATR-based offsets from a moving average.
This version replaces the moving average with percentile smoothing, which adapts better to price behavior.
Better Noise Filtering:
Since percentiles are less sensitive to outliers, this indicator reduces false signals in choppy markets.
More Adaptive to Market Conditions:
- The percentile smoothing dynamically adjusts trend detection based on price distribution rather than fixed calculations.
- Why It’s Useful
- ✅ Reduces Whipsaws: Helps minimize false breakouts by using percentile-based bands instead of traditional ATR-only bands.
- ✅ Works in Different Market Conditions: Effective in both trending and ranging environments due to its adaptive nature.
- ✅ Enhances Trend Confidence: Provides clearer signals by filtering noise more effectively than standard SuperTrend indicators.
Application Examples
- Trend Following: Use it to identify strong upward or downward trends.
- Stop-Loss Placement: The upper and lower bands can serve as dynamic stop-loss levels.
- Breakout Confirmation: Trend flips can confirm breakout signals from other indicators.
- Mean Reversion Strategy Filtering: The 25-75 range helps identify strong versus weak reversals.
Risks & Disclaimers
Not a Standalone Strategy: This indicator should be used with other confirmation tools like volume analysis, momentum oscillators, or support/resistance levels.
False Signals in Sideways Markets: Although it reduces noise, choppy markets can still generate occasional false trend flips.
Market Adaptation Required: The best parameters may vary depending on the asset and timeframe.
This indicator was heavily inspired and influenced by the IRS/viResearch Median SuperTrend, improving upon its concept by transforming its median based calculation into a more responsive & effective counterpart of its former self.
Shoutout to all my Masterclass Brothers and L4 Gs!
오픈 소스 스크립트
트레이딩뷰의 진정한 정신에 따라, 이 스크립트의 작성자는 이를 오픈소스로 공개하여 트레이더들이 기능을 검토하고 검증할 수 있도록 했습니다. 작성자에게 찬사를 보냅니다! 이 코드는 무료로 사용할 수 있지만, 코드를 재게시하는 경우 하우스 룰이 적용된다는 점을 기억하세요.
면책사항
해당 정보와 게시물은 금융, 투자, 트레이딩 또는 기타 유형의 조언이나 권장 사항으로 간주되지 않으며, 트레이딩뷰에서 제공하거나 보증하는 것이 아닙니다. 자세한 내용은 이용 약관을 참조하세요.
오픈 소스 스크립트
트레이딩뷰의 진정한 정신에 따라, 이 스크립트의 작성자는 이를 오픈소스로 공개하여 트레이더들이 기능을 검토하고 검증할 수 있도록 했습니다. 작성자에게 찬사를 보냅니다! 이 코드는 무료로 사용할 수 있지만, 코드를 재게시하는 경우 하우스 룰이 적용된다는 점을 기억하세요.
면책사항
해당 정보와 게시물은 금융, 투자, 트레이딩 또는 기타 유형의 조언이나 권장 사항으로 간주되지 않으며, 트레이딩뷰에서 제공하거나 보증하는 것이 아닙니다. 자세한 내용은 이용 약관을 참조하세요.