OPEN-SOURCE SCRIPT
NASDAQ Advance/Decline Line 1.0
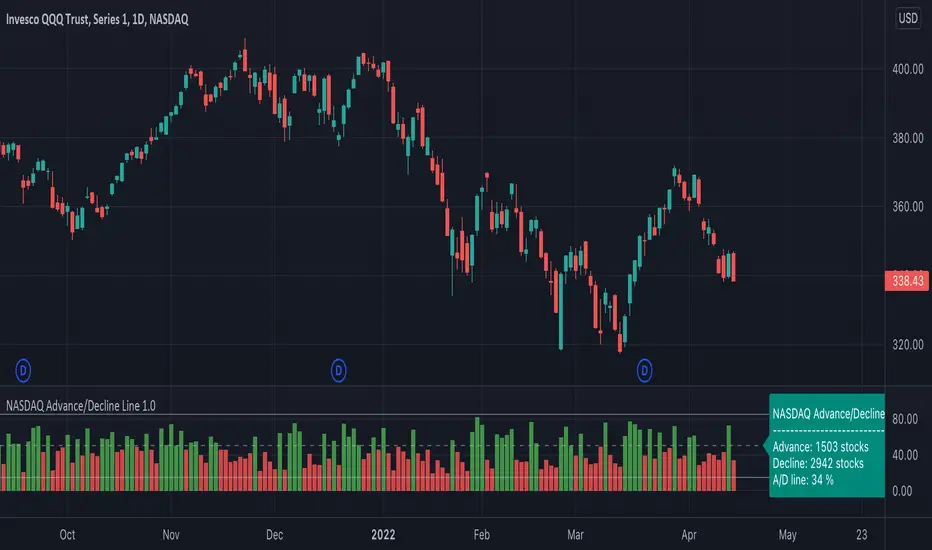
NASDAQ Advance/Decline Line is a Market Breath indicator.
Brought to you by IQ-trading (Andrei Bogdan) via Trading View Pine script. If you find this helpful in anyway, please leave a like!
A/D line calculates a ratio between total number of NASDAQ stocks advancing and total number of NASDAQ stocks in one day, providing another way to grasp the market breath at any moment.A
Green columns mean more than 50% of NASDAQ stocks are advancing, red columns mean more than 50% of NASDAQ stocks are declining.
Green values above the top band mean correlation to the upside, red values bellow the low band mean correlation to the downside.
Correlation means rising probability of capitulation (to the upside or to the downside).
For a better interpretation, NASDAQ Advance/Decline Line should be used in conjunction with other indicators (volatility, volume, etc.).
--------------------
NASDAQ here refers to the totality of assets listed on the NASDAQ exchange, not to the Nasdaq Composite index or the Nasdaq100 index.
NASDAQ is the second-largest stock exchange on earth, and operates the two major stock indexes based on companies that trade on its exchange: the Nasdaq Composite and the Nasdaq 100.
The Nasdaq Composite tracks the performance of more than 3,000 stocks listed on the Nasdaq while the Nasdaq 100 captures the performance of the exchange’s largest non-financial companies.
오픈 소스 스크립트
트레이딩뷰의 진정한 정신에 따라, 이 스크립트의 작성자는 이를 오픈소스로 공개하여 트레이더들이 기능을 검토하고 검증할 수 있도록 했습니다. 작성자에게 찬사를 보냅니다! 이 코드는 무료로 사용할 수 있지만, 코드를 재게시하는 경우 하우스 룰이 적용된다는 점을 기억하세요.
면책사항
해당 정보와 게시물은 금융, 투자, 트레이딩 또는 기타 유형의 조언이나 권장 사항으로 간주되지 않으며, 트레이딩뷰에서 제공하거나 보증하는 것이 아닙니다. 자세한 내용은 이용 약관을 참조하세요.
오픈 소스 스크립트
트레이딩뷰의 진정한 정신에 따라, 이 스크립트의 작성자는 이를 오픈소스로 공개하여 트레이더들이 기능을 검토하고 검증할 수 있도록 했습니다. 작성자에게 찬사를 보냅니다! 이 코드는 무료로 사용할 수 있지만, 코드를 재게시하는 경우 하우스 룰이 적용된다는 점을 기억하세요.
면책사항
해당 정보와 게시물은 금융, 투자, 트레이딩 또는 기타 유형의 조언이나 권장 사항으로 간주되지 않으며, 트레이딩뷰에서 제공하거나 보증하는 것이 아닙니다. 자세한 내용은 이용 약관을 참조하세요.