PROTECTED SOURCE SCRIPT
업데이트됨 Altman Z-Score Indicator
1. المنهج العلمي: ما هو نموذج ألتمان Z-Score؟
نموذج Z-Score هو صيغة إحصائية متعددة المتغيرات تم تطويرها في عام 1968 من قبل البروفيسور إدوارد ألتمان (Edward Altman)، أستاذ التمويل في جامعة نيويورك. الهدف الأساسي للنموذج هو التنبؤ باحتمالية إفلاس شركة مساهمة عامة خلال العامين التاليين.
يعتمد النموذج على دمج خمس نسب مالية أساسية، يتم استخلاصها من القوائم المالية للشركة (قائمة الدخل والميزانية العمومية). يتم ضرب كل نسبة في معامل (وزن) محدد، ثم يتم جمع النتائج للحصول على قيمة واحدة هي "Z-Score".
المعادلة الأساسية للشركات الصناعية العامة (وهي التي يطبقها الكود):
`Z = 1.2 X₁ + 1.4 X₂ + 3.3 X₃ + 0.6 X₄ + 1.0 X₅`
حيث أن:
X₁ = (رأس المال العامل / إجمالي الأصول): يقيس سيولة الشركة على المدى القصير. رأس المال العامل المرتفع يعني أن الشركة لديها أصول متداولة كافية لتغطية التزاماتها قصيرة الأجل.
X₂ = (الأرباح المحتجزة / إجمالي الأصول): يقيس الربحية التراكمية للشركة وقدرتها على تمويل أصولها من أرباحها الخاصة بدلاً من الديون.
X₃ = (الأرباح قبل الفوائد والضرائب (EBIT) / إجمالي الأصول): يقيس كفاءة الشركة في تحقيق أرباح من أصولها قبل احتساب تكاليف التمويل والضرائب. إنها مؤشر قوي على الربحية التشغيلية.
X₄ = (القيمة السوقية لحقوق الملكية / إجمالي الالتزامات): يقيس الرافعة المالية للشركة. كلما انخفضت قيمة الشركة السوقية مقارنة بديونها، زاد خطر الإفلاس.
X₅ = (إجمالي الإيرادات (المبيعات) / إجمالي الأصول): يعرف بـ "معدل دوران الأصول". يقيس مدى كفاءة الشركة في استخدام أصولها لتوليد المبيعات.
تفسير النتائج (مناطق التصنيف):
قام ألتمان بتحديد ثلاث مناطق لتصنيف الشركات بناءً على قيمة Z-Score:
1. منطقة الخطر (Distress Zone) | Z < 1.81: الشركات التي تقع في هذه المنطقة لديها احتمالية عالية جداً لمواجهة صعوبات مالية قد تؤدي إلى الإفلاس.
2. المنطقة الرمادية (Grey Zone) | 1.81 ≤ Z ≤ 2.99: الشركات في هذه المنطقة تقع في وضع غير مؤكد. لا يمكن تصنيفها بأنها آمنة أو في خطر وشيك، وتتطلب تحليلاً أعمق.
3. المنطقة الآمنة (Safe Zone) | Z > 2.99: الشركات التي تحقق نتيجة في هذه المنطقة تعتبر في وضع مالي سليم ومستقر، واحتمالية إفلاسها منخفضة جداً.
2. كيفية استخدام المؤشر على TradingView
الكود الذي قمت بتطويره يجعل استخدام هذا النموذج سهلاً للغاية. إليك كيفية استخدامه بفعالية:
1. التطبيق على الرسم البياني:
أضف المؤشر إلى الرسم البياني لأي سهم ترغب في تحليله. سيظهر المؤشر في نافذة منفصلة أسفل الرسم البياني للسعر.
2. فهم المدخلات (الإعدادات):
Symbol (الرمز): يمكنك ترك هذا الحقل فارغاً ليقوم المؤشر بتحليل السهم الحالي على الرسم البياني تلقائياً. أو يمكنك إدخال رمز سهم آخر (مثلاً `AAPL` أو `MSFT`) لتحليل تلك الشركة ومقارنتها بالشركة الحالية.
Fiscal Period (الفترة المالية): هذا هو أهم إعداد. يتيح لك اختيار البيانات التي سيعتمد عليها التحليل:
`FY` (سنوي): يستخدم بيانات آخر سنة مالية كاملة. هذا هو الخيار الأكثر شيوعاً واستقراراً.
`FQ` (ربع سنوي): يستخدم بيانات آخر ربع مالي. هذا الخيار أكثر حساسية للتغيرات قصيرة المدى.
`TTM` (آخر 12 شهراً): يستخدم البيانات المجمعة لآخر 12 شهراً. يوفر نظرة حديثة ومستمرة.
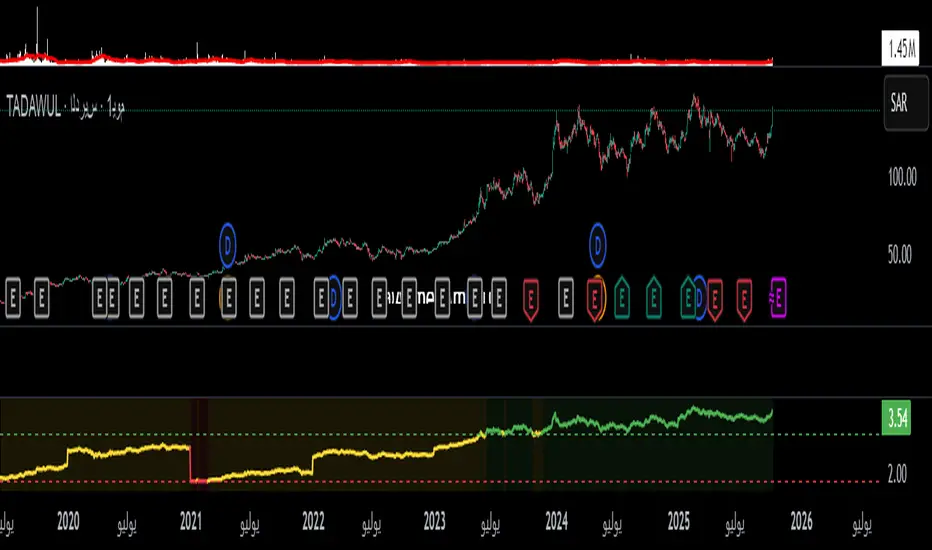
3. قراءة المخرجات البصرية:
خط Z-Score: هو الخط الرئيسي للمؤشر. حركته عبر الزمن توضح كيف يتغير الوضع المالي للشركة. هل يتحسن (الخط يرتفع) أم يتدهور (الخط ينخفض)؟
الخطوط المتقطعة: الخط الأخضر عند `2.99` والخط الأحمر عند `1.81` يمثلان حدود المناطق (الآمنة والخطر). عبور خط Z-Score لهذه الحدود يعتبر إشارة هامة.
الخلفية الملونة: هي أسرع طريقة لمعرفة وضع الشركة الحالي:
أخضر: الشركة في المنطقة الآمنة.
أصفر (رمادي): الشركة في المنطقة الرمادية.
أحمر: الشركة في منطقة الخطر.
4. الاستخدام العملي في التحليل:
التحليل الاتجاهي: لا تنظر فقط إلى القيمة الحالية. راقب اتجاه خط Z-Score على مدى عدة سنوات. شركة يرتفع مؤشرها باستمرار من 1.5 إلى 2.5 هي في مسار تحسن، بينما شركة ينخفض مؤشرها من 4.0 إلى 3.1 قد تكون في بداية مسار تدهور.
إشارات الإنذار المبكر: إذا انخفض Z-Score لشركة ما تحت 2.99 ودخل المنطقة الرمادية، فهذه دعوة للبدء في تحليل أعمق لأسباب هذا الانخفاض. إذا انخفض تحت 1.81، فهذه إشارة خطر واضحة يجب أخذها على محمل الجد.
المقارنة بين الشركات: استخدم حقل `Symbol` لمقارنة الصحة المالية لشركتين في نفس القطاع. أي منهما لديها Z-Score أعلى وأكثر استقراراً؟
تأكيد التحليل الأساسي: استخدم هذا المؤشر كأداة مساعدة بجانب تحليلاتك الأخرى، وليس كأداة وحيدة لاتخاذ القرار. فهو لا يأخذ في الاعتبار عوامل مثل الإدارة، الميزة التنافسية، أو ظروف السوق الكلية.
---
In English
1. The Scientific Method: What is the Altman Z-Score Model?
The Z-Score model is a multivariate statistical formula developed in 1968 by Dr. Edward Altman, a Professor of Finance at New York University. The primary objective of the model is to predict the probability of a publicly traded company going bankrupt within the next two years.
The model works by combining five key financial ratios derived from a company's financial statements (the income statement and balance sheet). Each ratio is multiplied by a specific coefficient (weight), and the results are summed up to produce a single value: the "Z-Score."
The Original Formula for Public Manufacturing Companies (which your code implements):
`Z = 1.2 X₁ + 1.4 X₂ + 3.3 X₃ + 0.6 X₄ + 1.0 X₅`
Where:
X₁ = (Working Capital / Total Assets): Measures the company's short-term liquidity. High working capital indicates the company has sufficient current assets to cover its short-term liabilities.
X₂ = (Retained Earnings / Total Assets): Measures the company's cumulative profitability and its ability to finance its assets with its own profits instead of debt.
X₃ = (Earnings Before Interest and Taxes (EBIT) / Total Assets): Measures the company's efficiency in generating profits from its assets before accounting for financing costs and taxes. It's a strong indicator of operational profitability.
X₄ = (Market Value of Equity / Total Liabilities): Measures the company's financial leverage. The more a company's market value declines relative to its debt, the higher the bankruptcy risk.
X₅ = (Total Revenue (Sales) / Total Assets): Known as "Asset Turnover." It measures how efficiently the company is using its assets to generate sales.
Interpreting the Score (The Zones of Discrimination):
Altman identified three zones to classify companies based on their Z-Score:
1. Distress Zone | Z < 1.81: Companies in this zone have a very high probability of facing financial distress that could lead to bankruptcy.
2. Grey Zone | 1.81 ≤ Z ≤ 2.99: Companies here are in an uncertain position. They cannot be classified as either safe or in imminent danger and require deeper analysis.
3. Safe Zone | Z > 2.99: Companies with a score in this zone are considered to be in a sound and stable financial position, with a very low probability of bankruptcy.
2. How to Use the Indicator on TradingView
The code you've developed makes using this model incredibly easy. Here is how to use it effectively:
1. Applying to the Chart:
Add the indicator to the chart of any stock you wish to analyze. The indicator will appear in a separate pane below the price chart.
2. Understanding the Inputs (Settings):
Symbol: You can leave this blank for the indicator to automatically analyze the current stock on the chart. Alternatively, you can enter another stock ticker (e.g., `AAPL` or `MSFT`) to analyze that company and compare it to the current one.
Fiscal Period: This is the most important setting. It lets you choose the data on which the analysis is based:
`FY` (Fiscal Year): Uses data from the last full fiscal year. This is the most common and stable option.
`FQ` (Fiscal Quarter): Uses data from the last fiscal quarter. This option is more sensitive to short-term changes.
`TTM` (Trailing Twelve Months): Uses aggregated data from the last 12 months, providing a recent and rolling view.
3. Reading the Visual Outputs:
Z-Score Line: This is the main plot of the indicator. Its movement over time shows how the company's financial health is evolving. Is it improving (line goes up) or deteriorating (line goes down)?
Dashed Lines: The green line at `2.99` and the red line at `1.81` represent the thresholds for the Safe and Distress zones. The Z-Score line crossing these thresholds is a significant signal.
Colored Background: This is the quickest way to see the company's current status:
Green: The company is in the Safe Zone.
Yellow (Grey): The company is in the Grey Zone.
Red: The company is in the Distress Zone.
4. Practical Use in Analysis:
Trend Analysis: Don't just look at the current value. Observe the trend of the Z-Score line over several years. A company whose score is consistently rising from 1.5 to 2.5 is on an improving path, whereas a company whose score is falling from 4.0 to 3.1 may be at the beginning of a deteriorating path.
Early Warning Signals: If a company's Z-Score drops below 2.99 into the Grey Zone, it's a call to start a deeper analysis into the reasons for this decline. If it drops below 1.81, it is a clear danger signal that must be taken seriously.
Peer Comparison: Use the `Symbol` input field to compare the financial health of two companies in the same sector. Which one has a higher and more stable Z-Score?
Fundamental Analysis Confirmation: Use this indicator as a supplementary tool alongside your other analyses, not as a sole decision-making tool. It does not account for factors like management quality, competitive advantage, or macroeconomic conditions.
릴리즈 노트
اختيار الصيغة الملائمة: أضيفت خاصية تسمح بتحديد نوع نموذج Z‑Score من قائمة تحتوي على الصيغ الأربع المعتمدة: الصيغة الأصلية للشركات الصناعية العامة، وصيغة Z‑Prime للشركات الخاصة، وصيغة Z‑Double للشركات غير الصناعية، ونموذج الأسواق الناشئة EMS الذي يضيف ثابتًا للتكيف مع ظروف الأسواق الناشئةstablebread.com
.
تخصيص الفترة المالية: يمكن للمستخدم اختيار الفترة التي يتم عليها حساب المؤشر، سواء ربع سنوية (FQ) أو نصف سنوية (FH) أو سنوية (FY) أو بيانات آخر 12 شهراً (TTM)، ما يوفر مرونة أكبر في متابعة التغيرات الحديثة في الأداء المالي
tradingview.com
.
إدخال حدود مرنة للمناطق: أصبح من الممكن تعديل مستويات المنطقة الآمنة ومنطقة الخطر يدويًا حسب طبيعة السوق أو الصناعة، بدلاً من الاعتماد على القيم القياسية 2.99 و1.81.
تنوع المعاملات: يتم تغيير أوزان المتغيرات (X1 إلى X5) تلقائيًا وفقًا للصيغة المختارة، كما يتم التبديل بين القيمة السوقية لحقوق الملكية أو القيمة الدفترية عند الحاجة.
تحسين واجهة العرض: تم تحسين التلوين التلقائي للخطوط والخلفية بحسب حالة الشركة (آمنة، رمادية، خطرة)، مع إظهار ملصق يوضح نوع النموذج والنتيجة في آخر الشارت.
إصلاح أخطاء سابقة: تم استخدام أحرف ASCII وإزالة الفواصل غير الضرورية بين الأسطر، وتهيئة المتغيرات الرقمية بقيم صفرية لتجنب أخطاء أنواع البيانات.
Updates Added to the Z‑Score Indicator (English)
Model Selection: A new input lets users choose among four Z‑Score variants: the original formula for public manufacturing firms, Z‑Prime for private companies, Z‑Double for non‑manufacturing firms, and the EMS version tailored for emerging markets
stablebread.com
.
Flexible Fiscal Period: Users can now select the fiscal period over which the metrics are calculated—quarterly (FQ), semi‑annual (FH), annual (FY), or trailing 12 months (TTM). This enables more current analysis
tradingview.com
.
Adjustable Thresholds: The safe and distress thresholds are exposed as inputs, allowing fine‑tuning based on market conditions instead of relying solely on the classic 2.99 and 1.81 cut‑offs.
Dynamic Coefficients: The script automatically assigns the correct weights (coefficients) to the X variables depending on the chosen variant and switches between market equity and book equity where appropriate.
Enhanced Visualization: Color‑coding for lines and background zones has been refined, and a label displays the selected variant and computed score on the last bar.
Bug Fixes: ASCII characters replace non‑standard hyphens, multi‑line function calls are consolidated, and coefficient variables are initialized to zero to prevent type errors.
보호된 스크립트입니다
이 스크립트는 비공개 소스로 게시됩니다. 하지만 제한 없이 자유롭게 사용할 수 있습니다 — 여기에서 자세히 알아보기.
Ahmed Amin
00201227212691
twitter.com/AhmedAminTC
snapchat.com/add/ahmedamintc?share_id=SQYebO-s9zs&locale=en-EG
00201227212691
twitter.com/AhmedAminTC
snapchat.com/add/ahmedamintc?share_id=SQYebO-s9zs&locale=en-EG
면책사항
이 정보와 게시물은 TradingView에서 제공하거나 보증하는 금융, 투자, 거래 또는 기타 유형의 조언이나 권고 사항을 의미하거나 구성하지 않습니다. 자세한 내용은 이용 약관을 참고하세요.