OPEN-SOURCE SCRIPT
업데이트됨 Fisher MPz
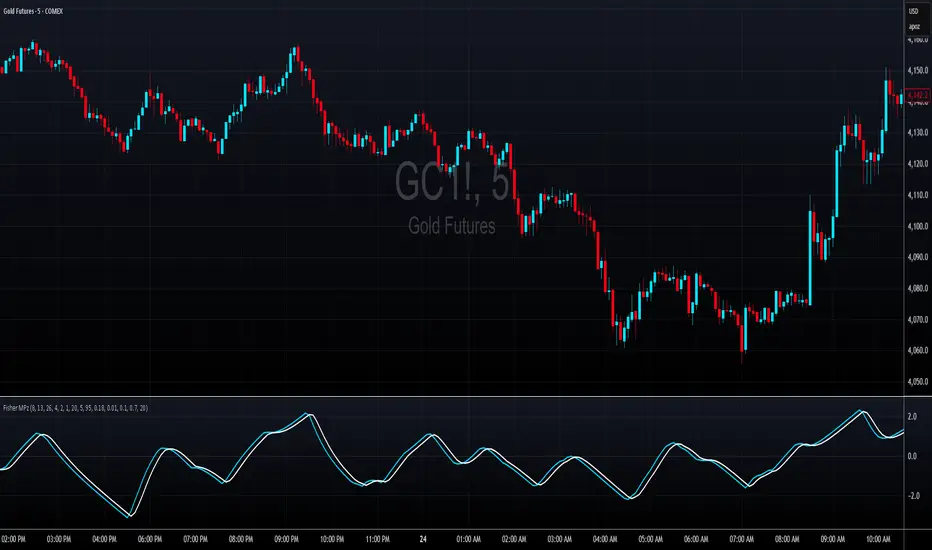
Fisher MPz - Multi-Period Z-Score Fisher Transform
Overview
An enhanced Fisher Transform that uses multi-period analysis and improved statistical methods to provide more reliable trading signals with the goal of fewer false positives.
Evolution Beyond Traditional Fisher Transform
While the classic Fisher Transform uses simple price normalization and basic smoothing, Fisher MPz introduces several key enhancements:
- Multi-period composite instead of single timeframe analysis
- Robust z-score normalization using median/MAD rather than mean/standard deviation
- Winsorization to handle outliers and price spikes
- Dynamic clipping that adapts to market volatility
- Kalman filtering for superior noise reduction vs. traditional EMA smoothing
These improvements result in cleaner signals, better adaptability to different market conditions, handles trending markets without over-saturation at extreme values, and reduced false signals compared to the standard Fisher Transform.
Key Features
Multi-Period Analysis
- Three Timeframe Approach: Simultaneously analyzes short (default 8), medium (default 13), and long (default 26) periods
- Weighted Composite: Combines all three periods using customizable weights for optimal signal generation
- Individual Period Display: Optional visualization of each period's Fisher Transform for deeper analysis
Advanced Statistical Methods
Robust Z-Score Calculation
- Uses median and MAD (Median Absolute Deviation) instead of mean and standard deviation
- More resistant to outliers and extreme price movements
- Provides stable normalization across varying market conditions
Winsorization
- Caps extreme price values at specified percentiles (default 5th and 95th)
- Reduces the impact of price spikes and anomalies
- Configurable lookback period for threshold calculation
Dynamic Z-Score Clipping
- Automatically adjusts clipping levels based on recent volatility
- Tighter bounds in calm markets (0.05) for precision
- Wider bounds in volatile markets (0.2) to capture significant moves
- Uses ATR-based volatility measurement
Kalman Filter Smoothing
- Optional advanced noise reduction using Kalman filtering
- Superior to traditional EMA smoothing for optimal signal extraction
- Configurable process noise (Q) and measurement noise (R) parameters
- Fallback to traditional smoothing factor available
How to Use
Basic Interpretation
- Above Zero: Bullish momentum
- Below Zero: Bearish momentum
- Extreme Values: Potential overbought/oversold conditions
- Crossovers: Entry/exit signals when composite crosses trigger line
Customizable Settings
Periods: Adjust based on your trading timeframe
- Lower values (3-10): More sensitive, suitable for scalping
- Medium values (10-20): Balanced for swing trading
- Higher values (20-50): Smoother for position trading
Weights: Customize responsiveness
- Increase short weight: More reactive to recent price changes
- Increase long weight: More stability and trend confirmation
Kalman Settings
- Lower Q (0.001-0.02): Smoother, more filtered signals
- Higher Q (0.02-0.1): More responsive to price changes
- Lower R (0.01-0.05): Trust data more, less filtering
- Higher R (0.1-1.0): More skeptical of data, more smoothing
릴리즈 노트
Added new visual style오픈 소스 스크립트
트레이딩뷰의 진정한 정신에 따라, 이 스크립트의 작성자는 이를 오픈소스로 공개하여 트레이더들이 기능을 검토하고 검증할 수 있도록 했습니다. 작성자에게 찬사를 보냅니다! 이 코드는 무료로 사용할 수 있지만, 코드를 재게시하는 경우 하우스 룰이 적용된다는 점을 기억하세요.
discord.gg/REapC6SGtz
b3artrades@gmail.com
b3artrades@gmail.com
면책사항
해당 정보와 게시물은 금융, 투자, 트레이딩 또는 기타 유형의 조언이나 권장 사항으로 간주되지 않으며, 트레이딩뷰에서 제공하거나 보증하는 것이 아닙니다. 자세한 내용은 이용 약관을 참조하세요.
오픈 소스 스크립트
트레이딩뷰의 진정한 정신에 따라, 이 스크립트의 작성자는 이를 오픈소스로 공개하여 트레이더들이 기능을 검토하고 검증할 수 있도록 했습니다. 작성자에게 찬사를 보냅니다! 이 코드는 무료로 사용할 수 있지만, 코드를 재게시하는 경우 하우스 룰이 적용된다는 점을 기억하세요.
discord.gg/REapC6SGtz
b3artrades@gmail.com
b3artrades@gmail.com
면책사항
해당 정보와 게시물은 금융, 투자, 트레이딩 또는 기타 유형의 조언이나 권장 사항으로 간주되지 않으며, 트레이딩뷰에서 제공하거나 보증하는 것이 아닙니다. 자세한 내용은 이용 약관을 참조하세요.