INVITE-ONLY SCRIPT
Breakout of inclined trendline [Drobode]
█ DESCRIPTION
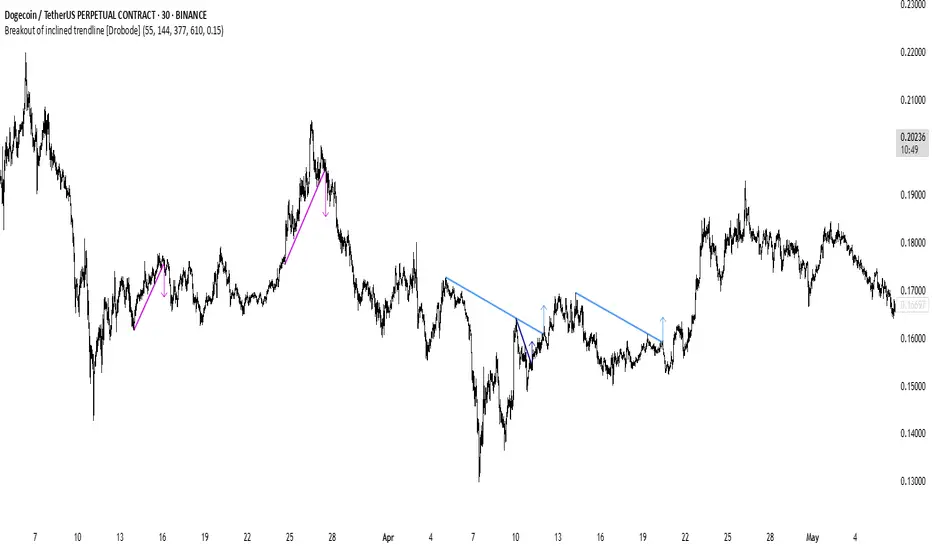
The script is designed to automatically detect a possible trendline breakout under the conditions of the popular "Slanted Trendline Breakout" strategy. The algorithm assumes that during the movement the price approaches the slanted (trend) line several times. With each subsequent approach (touch) to the trend line, the price consolidates more and more near this line, the distances between the extremes (touches) decrease, which indicates a high probability of a breakout of this line. The script checks the number of touches (approaches) of the extremes and the distances between the extremes. If all conditions are met, the script draws a slanted (trend) line in the corresponding area and an arrow with a possible price breakout direction. The length of the arrow is half the height of the slanted (trend) line and may indicate the level (price) at which it is advisable to fix the profit. In the script, you can enable or disable additional analysis periods (history length, number of bars), the more periods are enabled, the slower the script may load. For example, when placing the script on M-15, we can additionally enable the period 300 or 500, which will allow us to take into account a larger number of historical bars, and this can be considered as the extremes of the older timeframe. The script calculates each period separately, so one large period will not be able to take into account and analyze smaller periods. You can set the percentage deviation of the distance of the extremes from the trend line that touch the inclined line, depending on your needs and style of technical analysis. The smaller the percentage, the more accurate and closer to the inclined line the price extreme should be and vice versa. The main goal of the script is to facilitate the trader's routine work of identifying a possible trend line breakout. However, it should be understood that the script is not a full-fledged self-sufficient strategy, in case of receiving a signal, it is recommended to additionally conduct a comprehensive thorough analysis before taking trading actions. The script can be useful for traders of all levels, both beginners and experienced analysts. Like any other strategy or script, this script can work better on some instruments than on others. When analyzing trading setups, it is desirable to have a clear trend, it is recommended to take into account the signal of this script with a small period when the arrow shows the direction of the trend. However, at the same time, it is necessary to deeply analyze many other factors at this stage, in particular, such as volumes, consolidation, volatility, candlestick patterns, etc.
█ SCRIPT SETTINGS
Alert
The Alert function in the script is enabled by default, you just need to activate Alert in the TradingView window and select the signal source - Breakout of inclined trendline [Drobode].
The notification provides the following information (example):
Periods length
The script allows you to set the length of the period (number of bars) for which the calculation will be performed. Different periods allow you to cover more timeframes (in particular, larger timeframes). You can change up to 4 periods at a time. However, if you choose too large periods, the script may slow down and the loading time will increase. To increase the loading speed of the script, disable additional periods 3, 4, i.e. uncheck the corresponding checkboxes and use only fields 1 and 2 for periods, where you can also set the period length you need.
Percentage deviation of extremes from the trend line
The next settings are the percentage deviation of the extremes from the sloping line. The smaller the deviation, the more accurate and closer to the line the extreme bars should be, however, in this case the number of identification signals will be smaller. By default, the rejection zone is - 0.15%. On larger timeframes, the deviation can be set to be larger.
The script is designed to automatically detect a possible trendline breakout under the conditions of the popular "Slanted Trendline Breakout" strategy. The algorithm assumes that during the movement the price approaches the slanted (trend) line several times. With each subsequent approach (touch) to the trend line, the price consolidates more and more near this line, the distances between the extremes (touches) decrease, which indicates a high probability of a breakout of this line. The script checks the number of touches (approaches) of the extremes and the distances between the extremes. If all conditions are met, the script draws a slanted (trend) line in the corresponding area and an arrow with a possible price breakout direction. The length of the arrow is half the height of the slanted (trend) line and may indicate the level (price) at which it is advisable to fix the profit. In the script, you can enable or disable additional analysis periods (history length, number of bars), the more periods are enabled, the slower the script may load. For example, when placing the script on M-15, we can additionally enable the period 300 or 500, which will allow us to take into account a larger number of historical bars, and this can be considered as the extremes of the older timeframe. The script calculates each period separately, so one large period will not be able to take into account and analyze smaller periods. You can set the percentage deviation of the distance of the extremes from the trend line that touch the inclined line, depending on your needs and style of technical analysis. The smaller the percentage, the more accurate and closer to the inclined line the price extreme should be and vice versa. The main goal of the script is to facilitate the trader's routine work of identifying a possible trend line breakout. However, it should be understood that the script is not a full-fledged self-sufficient strategy, in case of receiving a signal, it is recommended to additionally conduct a comprehensive thorough analysis before taking trading actions. The script can be useful for traders of all levels, both beginners and experienced analysts. Like any other strategy or script, this script can work better on some instruments than on others. When analyzing trading setups, it is desirable to have a clear trend, it is recommended to take into account the signal of this script with a small period when the arrow shows the direction of the trend. However, at the same time, it is necessary to deeply analyze many other factors at this stage, in particular, such as volumes, consolidation, volatility, candlestick patterns, etc.
█ SCRIPT SETTINGS
By default, the script was developed and tested on medium timeframes with cryptocurrency futures instruments USDT.P
Alert
The Alert function in the script is enabled by default, you just need to activate Alert in the TradingView window and select the signal source - Breakout of inclined trendline [Drobode].
The notification provides the following information (example):
- Possible breakout to the upside
- Ticker- DOGEUSDT.P
- Price- 0.15844
- Timeframe- 30
- Period length- 377
Periods length
The script allows you to set the length of the period (number of bars) for which the calculation will be performed. Different periods allow you to cover more timeframes (in particular, larger timeframes). You can change up to 4 periods at a time. However, if you choose too large periods, the script may slow down and the loading time will increase. To increase the loading speed of the script, disable additional periods 3, 4, i.e. uncheck the corresponding checkboxes and use only fields 1 and 2 for periods, where you can also set the period length you need.
Percentage deviation of extremes from the trend line
The next settings are the percentage deviation of the extremes from the sloping line. The smaller the deviation, the more accurate and closer to the line the extreme bars should be, however, in this case the number of identification signals will be smaller. By default, the rejection zone is - 0.15%. On larger timeframes, the deviation can be set to be larger.
초대 전용 스크립트
이 스크립트는 작성자가 승인한 사용자만 접근할 수 있습니다. 사용하려면 요청 후 승인을 받아야 하며, 일반적으로 결제 후에 허가가 부여됩니다. 자세한 내용은 아래 작성자의 안내를 따르거나 Drobode에게 직접 문의하세요.
트레이딩뷰는 스크립트의 작동 방식을 충분히 이해하고 작성자를 완전히 신뢰하지 않는 이상, 해당 스크립트에 비용을 지불하거나 사용하는 것을 권장하지 않습니다. 커뮤니티 스크립트에서 무료 오픈소스 대안을 찾아보실 수도 있습니다.
작성자 지시 사항
To access the script, you need to go to the website https://tradescripttools.vercel.app/en
면책사항
해당 정보와 게시물은 금융, 투자, 트레이딩 또는 기타 유형의 조언이나 권장 사항으로 간주되지 않으며, 트레이딩뷰에서 제공하거나 보증하는 것이 아닙니다. 자세한 내용은 이용 약관을 참조하세요.