OPEN-SOURCE SCRIPT
ADX Trend Visualizer with Dual Thresholds
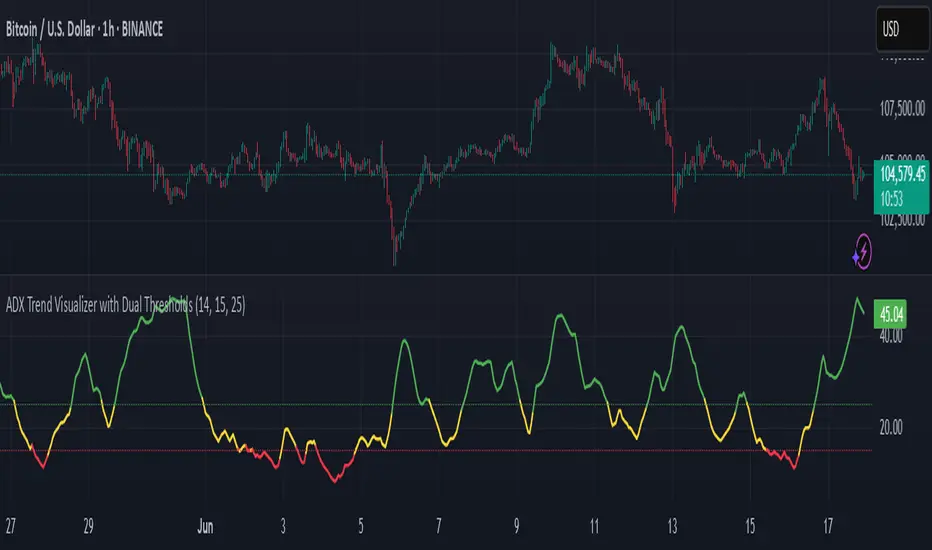
ADX Trend Visualizer with Dual Thresholds
A minimal, color coded ADX indicator designed to filter market conditions into weak, moderate, or strong trend phases.
Uses a dual threshold system for separating weak, moderate, and strong trend conditions.
Color coded ADX line:
Two horizontal reference lines plotted at threshold levels
Optional +DI and -DI lines (Style tab)
Recommended Use:
This trend validator helps highlight strong directional moves and avoid weak market conditions
A minimal, color coded ADX indicator designed to filter market conditions into weak, moderate, or strong trend phases.
Uses a dual threshold system for separating weak, moderate, and strong trend conditions.
Color coded ADX line:
- Green– Strong trend (above upper threshold)
- Yellow – Moderate trend (between thresholds)
- Red – Weak or no trend (below lower threshold)
Two horizontal reference lines plotted at threshold levels
Optional +DI and -DI lines (Style tab)
Recommended Use:
- Use on higher time frames (1h and above) as a trend filter
- Combine with entry/exit signals from other indicators or strategies
- Avoid possible false entries when ADX is below the weak threshold
This trend validator helps highlight strong directional moves and avoid weak market conditions
오픈 소스 스크립트
트레이딩뷰의 진정한 정신에 따라, 이 스크립트의 작성자는 이를 오픈소스로 공개하여 트레이더들이 기능을 검토하고 검증할 수 있도록 했습니다. 작성자에게 찬사를 보냅니다! 이 코드는 무료로 사용할 수 있지만, 코드를 재게시하는 경우 하우스 룰이 적용된다는 점을 기억하세요.
면책사항
해당 정보와 게시물은 금융, 투자, 트레이딩 또는 기타 유형의 조언이나 권장 사항으로 간주되지 않으며, 트레이딩뷰에서 제공하거나 보증하는 것이 아닙니다. 자세한 내용은 이용 약관을 참조하세요.
오픈 소스 스크립트
트레이딩뷰의 진정한 정신에 따라, 이 스크립트의 작성자는 이를 오픈소스로 공개하여 트레이더들이 기능을 검토하고 검증할 수 있도록 했습니다. 작성자에게 찬사를 보냅니다! 이 코드는 무료로 사용할 수 있지만, 코드를 재게시하는 경우 하우스 룰이 적용된다는 점을 기억하세요.
면책사항
해당 정보와 게시물은 금융, 투자, 트레이딩 또는 기타 유형의 조언이나 권장 사항으로 간주되지 않으며, 트레이딩뷰에서 제공하거나 보증하는 것이 아닙니다. 자세한 내용은 이용 약관을 참조하세요.