OPEN-SOURCE SCRIPT
APEX - ADX/ADXR/DI+/DI- [v1]
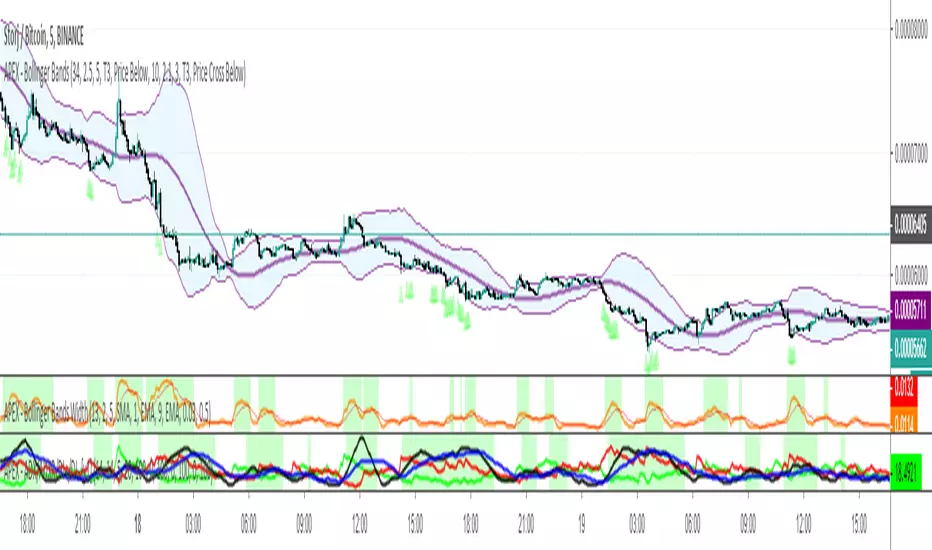
Average Directional Movement Index – ADX can be used to help measure the overall strength of a trend. The ADX indicator is an average of expanding price range values. The ADX is a component of the Directional Movement System developed by Welles Wilder. This indicator on its own does not give you a direction but instead measure the strength of the trend. In general values above 20 are considered a trending environment above 30 is then a strong trend and above 50 is a very strong trend.
Average Directional Movement Rating is based on the momentum change of the ADX itself. It is calculated by adding two ADX values (the current value and a value n periods back), then dividing by two. This additional smoothing makes than the ADXR slightly less responsive than ADX but helps to avoid noise.
Minus Directional Indicator (-DI) measures the presence of a downtrend and is part of the Average Directional Index (ADX). If -DI is sloping upward, it's a sign that the price downtrend is getting stronger. The Positive Directional Indicator (+DI) is a component of the Average Directional Index (ADX) and is used to measure the presence of an uptrend. When the +DI is sloping upward, it is a signal that the uptrend is getting stronger. In general values above 20 are considered a trending environment above 30 is then a strong trend and above 50 is a very strong trend.
오픈 소스 스크립트
트레이딩뷰의 진정한 정신에 따라, 이 스크립트의 작성자는 이를 오픈소스로 공개하여 트레이더들이 기능을 검토하고 검증할 수 있도록 했습니다. 작성자에게 찬사를 보냅니다! 이 코드는 무료로 사용할 수 있지만, 코드를 재게시하는 경우 하우스 룰이 적용된다는 점을 기억하세요.
면책사항
해당 정보와 게시물은 금융, 투자, 트레이딩 또는 기타 유형의 조언이나 권장 사항으로 간주되지 않으며, 트레이딩뷰에서 제공하거나 보증하는 것이 아닙니다. 자세한 내용은 이용 약관을 참조하세요.
오픈 소스 스크립트
트레이딩뷰의 진정한 정신에 따라, 이 스크립트의 작성자는 이를 오픈소스로 공개하여 트레이더들이 기능을 검토하고 검증할 수 있도록 했습니다. 작성자에게 찬사를 보냅니다! 이 코드는 무료로 사용할 수 있지만, 코드를 재게시하는 경우 하우스 룰이 적용된다는 점을 기억하세요.
면책사항
해당 정보와 게시물은 금융, 투자, 트레이딩 또는 기타 유형의 조언이나 권장 사항으로 간주되지 않으며, 트레이딩뷰에서 제공하거나 보증하는 것이 아닙니다. 자세한 내용은 이용 약관을 참조하세요.