OPEN-SOURCE SCRIPT
업데이트됨 High/Low last 1-3 candles

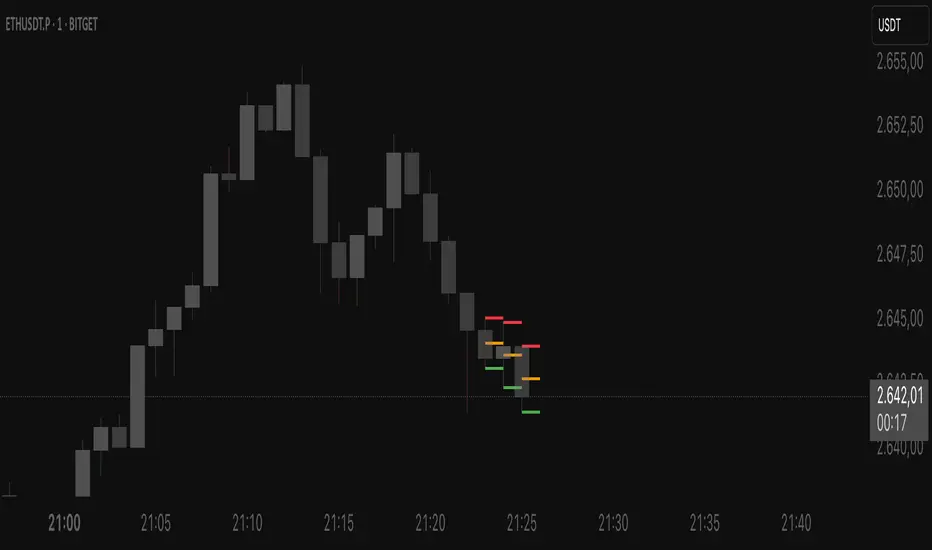
Here you can display the high and low of the last 1, 2 or 3 candles. The whole thing is updated with every new candle. you can also switch the lines on or off as you wish and adjust the colour of the lines. have fun with it
릴리즈 노트
Dynamic Candle Levels — High/Low & 50% Lines LiveThis indicator dynamically visualizes the key price levels of the current and recent candles in real-time.
Automatically draws lines at the highs and lows of the last X candles
Marks the 50% level of each candle with horizontal lines
Updates the lines of the currently forming candle live as high, low, and midpoint change
Fully customizable colors, line widths, and number of displayed candles
Perfect for quickly identifying support and resistance zones or intermediate levels at a glance to make faster trading decisions.
Settings:
Number of candles for high/low and 50% lines
Colors and widths of the lines
Option to show live lines for the current candle
오픈 소스 스크립트
트레이딩뷰의 진정한 정신에 따라, 이 스크립트의 작성자는 이를 오픈소스로 공개하여 트레이더들이 기능을 검토하고 검증할 수 있도록 했습니다. 작성자에게 찬사를 보냅니다! 이 코드는 무료로 사용할 수 있지만, 코드를 재게시하는 경우 하우스 룰이 적용된다는 점을 기억하세요.
면책사항
해당 정보와 게시물은 금융, 투자, 트레이딩 또는 기타 유형의 조언이나 권장 사항으로 간주되지 않으며, 트레이딩뷰에서 제공하거나 보증하는 것이 아닙니다. 자세한 내용은 이용 약관을 참조하세요.
오픈 소스 스크립트
트레이딩뷰의 진정한 정신에 따라, 이 스크립트의 작성자는 이를 오픈소스로 공개하여 트레이더들이 기능을 검토하고 검증할 수 있도록 했습니다. 작성자에게 찬사를 보냅니다! 이 코드는 무료로 사용할 수 있지만, 코드를 재게시하는 경우 하우스 룰이 적용된다는 점을 기억하세요.
면책사항
해당 정보와 게시물은 금융, 투자, 트레이딩 또는 기타 유형의 조언이나 권장 사항으로 간주되지 않으며, 트레이딩뷰에서 제공하거나 보증하는 것이 아닙니다. 자세한 내용은 이용 약관을 참조하세요.