OPEN-SOURCE SCRIPT
업데이트됨 Recession Indicator (Unemployment Rate)
Unemployment rate
percentage of unemployed individuals in an economy among individuals currently in the labour force. It is calcuated as Unemployed IndividualsTotal Labour Force × 100 where unemployed individuals are those who are currently not working but are actively seeking work.
The unemployment rate is one of the primary economic indicators used to measure the health of an economy. It tends to fluctuate with the business cycle, increasing during recessions and decreasing during expansions. It is among the indicators most commonly watched by policy makers, investors, and the general public.
Policy makers and central banks consider how much the unemployment rate has increased during a particular recession to gauge the recession’s impact on the economy and to decide how to tailor fiscal and monetary policies to mitigate its adverse effects. In addition, central banks carefully try to predict the future trend of the unemployment rate to devise long-term strategies to lower it.
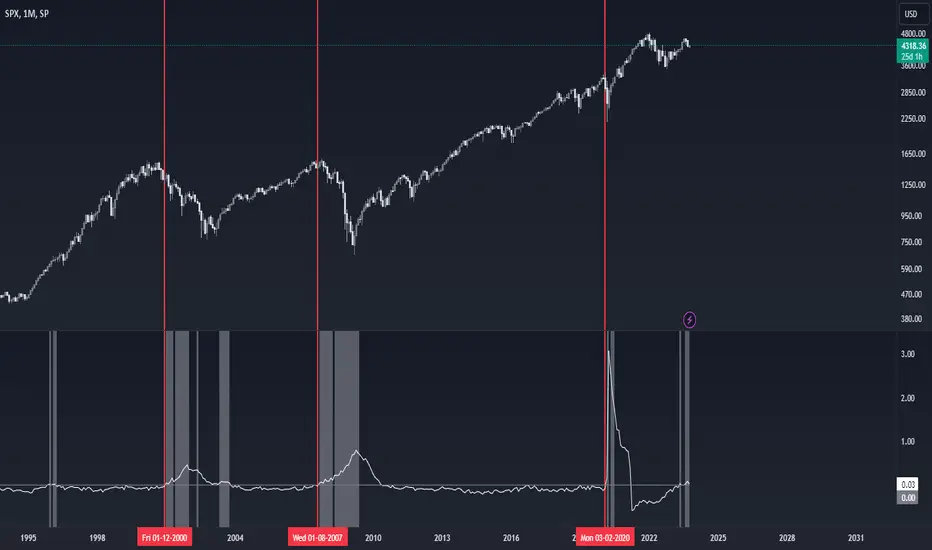
This indicator is a representation of yearly rate of change of Unemployment rate. Historically (not always) when ROC(Yearly) of Unemployment rate crossover zero line was a signal of recession or economic contraction.
percentage of unemployed individuals in an economy among individuals currently in the labour force. It is calcuated as Unemployed IndividualsTotal Labour Force × 100 where unemployed individuals are those who are currently not working but are actively seeking work.
The unemployment rate is one of the primary economic indicators used to measure the health of an economy. It tends to fluctuate with the business cycle, increasing during recessions and decreasing during expansions. It is among the indicators most commonly watched by policy makers, investors, and the general public.
Policy makers and central banks consider how much the unemployment rate has increased during a particular recession to gauge the recession’s impact on the economy and to decide how to tailor fiscal and monetary policies to mitigate its adverse effects. In addition, central banks carefully try to predict the future trend of the unemployment rate to devise long-term strategies to lower it.
This indicator is a representation of yearly rate of change of Unemployment rate. Historically (not always) when ROC(Yearly) of Unemployment rate crossover zero line was a signal of recession or economic contraction.
릴리즈 노트
Added comments오픈 소스 스크립트
트레이딩뷰의 진정한 정신에 따라, 이 스크립트의 작성자는 이를 오픈소스로 공개하여 트레이더들이 기능을 검토하고 검증할 수 있도록 했습니다. 작성자에게 찬사를 보냅니다! 이 코드는 무료로 사용할 수 있지만, 코드를 재게시하는 경우 하우스 룰이 적용된다는 점을 기억하세요.
면책사항
해당 정보와 게시물은 금융, 투자, 트레이딩 또는 기타 유형의 조언이나 권장 사항으로 간주되지 않으며, 트레이딩뷰에서 제공하거나 보증하는 것이 아닙니다. 자세한 내용은 이용 약관을 참조하세요.
오픈 소스 스크립트
트레이딩뷰의 진정한 정신에 따라, 이 스크립트의 작성자는 이를 오픈소스로 공개하여 트레이더들이 기능을 검토하고 검증할 수 있도록 했습니다. 작성자에게 찬사를 보냅니다! 이 코드는 무료로 사용할 수 있지만, 코드를 재게시하는 경우 하우스 룰이 적용된다는 점을 기억하세요.
면책사항
해당 정보와 게시물은 금융, 투자, 트레이딩 또는 기타 유형의 조언이나 권장 사항으로 간주되지 않으며, 트레이딩뷰에서 제공하거나 보증하는 것이 아닙니다. 자세한 내용은 이용 약관을 참조하세요.