OPEN-SOURCE SCRIPT
FVG
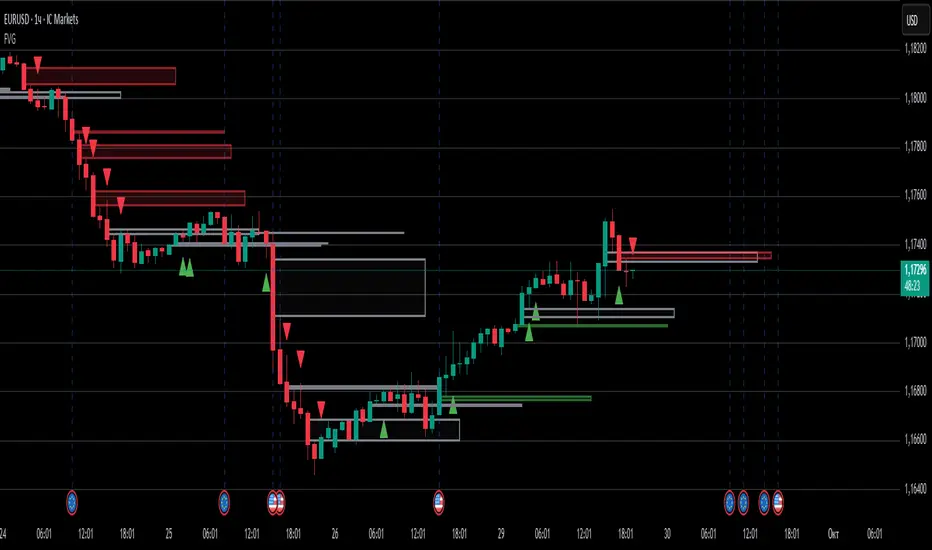
FVG (Fair Value Gap) Indicator
The Fair Value Gap (FVG) indicator is a powerful tool designed to identify price imbalance zones that often act as critical support and resistance levels in the market. An FVG occurs when there is a gap between the high of one candle and the low of another candle two periods away, creating an unfilled price area that the market tends to revisit. These zones represent areas where institutional orders may be waiting and can provide high-probability trading opportunities.
This indicator automatically detects both bullish and bearish FVGs across any selected timeframe while ensuring complete reliability with no repainting. It uses only confirmed bar data with lookahead protection, making it suitable for live trading and backtesting. The tool features customizable visual elements including zone colors, transparency levels, and timeframe labels, along with automatic mitigation tracking that monitors when FVGs get filled by price action.
Key features include multi-timeframe analysis, extending zones to the right for ongoing relevance, flexible display options for both active and mitigated FVGs, and built-in alert system for new FVG formations. The indicator also provides comprehensive labeling options and maintains a clean chart by automatically managing the maximum number of displayed zones, making it an essential tool for traders following smart money concepts and institutional trading strategies.
오픈 소스 스크립트
진정한 트레이딩뷰 정신에 따라 이 스크립트 작성자는 트레이더가 기능을 검토하고 검증할 수 있도록 오픈소스로 공개했습니다. 작성자에게 찬사를 보냅니다! 무료로 사용할 수 있지만 코드를 다시 게시할 경우 하우스 룰이 적용된다는 점을 기억하세요.
면책사항
이 정보와 게시물은 TradingView에서 제공하거나 보증하는 금융, 투자, 거래 또는 기타 유형의 조언이나 권고 사항을 의미하거나 구성하지 않습니다. 자세한 내용은 이용 약관을 참고하세요.
오픈 소스 스크립트
진정한 트레이딩뷰 정신에 따라 이 스크립트 작성자는 트레이더가 기능을 검토하고 검증할 수 있도록 오픈소스로 공개했습니다. 작성자에게 찬사를 보냅니다! 무료로 사용할 수 있지만 코드를 다시 게시할 경우 하우스 룰이 적용된다는 점을 기억하세요.
면책사항
이 정보와 게시물은 TradingView에서 제공하거나 보증하는 금융, 투자, 거래 또는 기타 유형의 조언이나 권고 사항을 의미하거나 구성하지 않습니다. 자세한 내용은 이용 약관을 참고하세요.