OPEN-SOURCE SCRIPT
업데이트됨 Smooth RSI [MarktQuant]
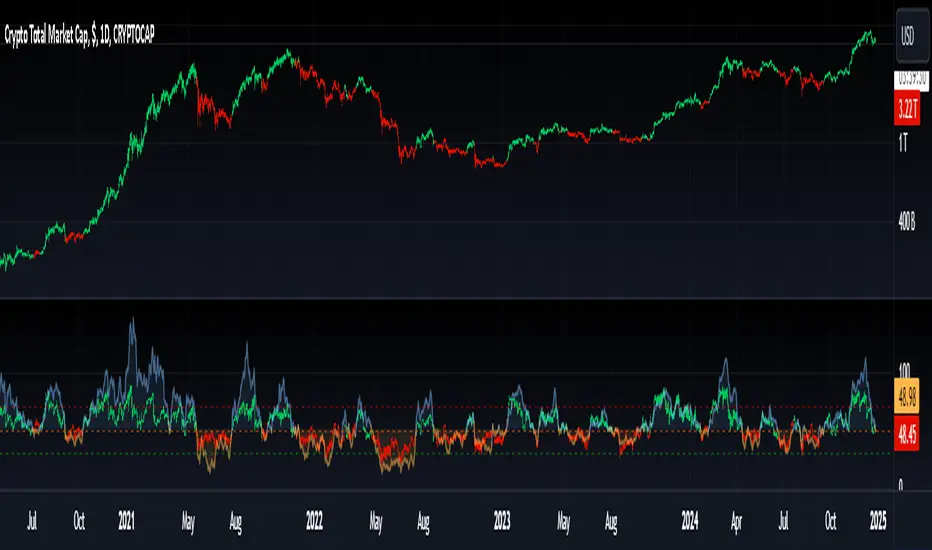
This indicator combines elements of the Relative Strength Index (RSI) and Rate of Change (RoC) to provide a smoother and potentially more insightful view of market momentum and price movement. The Smooth RSI [MarktQuant] calculates RSI values across four price points (high, open, low, close) to average them, offering a less volatile RSI signal. Additionally, it incorporates a Rate of Change for trend confirmation, enhancing the decision-making process for trade entries and exits.
Features:
Visual Signals:

Customizable Display:
Inputs:
Usage:
Long signals are indicated when the average RSI is above 50 and the RoC is positive.
Short signals are suggested when the average RSI falls below 50 with a negative RoC.
The color coding helps visually confirm trends at a glance.
Notes:
This indicator is best used in conjunction with other analysis methods to confirm signals.
Adjust the length parameters based on your trading timeframe for optimal results.
Disclaimer:
This indicator does not guarantee trading success; use it as part of a comprehensive trading strategy. Always conduct your own analysis before making trading decisions.
Features:
- Multi-RSI Calculation: RSI is computed for high, open, low, and close prices, then averaged to reduce noise.
- Trend Confirmation with RoC: Uses the Rate of Change to validate the RSI signals, coloring bars based on the trend direction.
Visual Signals:
- Bar colors change based on combined RSI and RoC signals.
- Green for bullish signals (RSI above 50 and positive RoC).
- Red for bearish signals (RSI below 50 and negative RoC).
- Horizontal lines at 30, 50, and 70 to denote overbought, neutral, and oversold conditions.
Customizable Display:
- Option to show/hide RSI plot or RoC plot for cleaner charts.
- Candle plot overlay option to visualize current price action alongside the indicator.
Inputs:
- RSI Length: Default 28. Adjusts the lookback period for RSI calculation.
- RoC Length: Default 28. Sets the period for the Rate of Change calculation.
- Plot Settings:
- Show RSI - Toggle RSI plot visibility.
- Show RoC - Toggle RoC plot visibility.
Usage:
Long signals are indicated when the average RSI is above 50 and the RoC is positive.
Short signals are suggested when the average RSI falls below 50 with a negative RoC.
The color coding helps visually confirm trends at a glance.
Notes:
This indicator is best used in conjunction with other analysis methods to confirm signals.
Adjust the length parameters based on your trading timeframe for optimal results.
Disclaimer:
This indicator does not guarantee trading success; use it as part of a comprehensive trading strategy. Always conduct your own analysis before making trading decisions.
릴리즈 노트
.오픈 소스 스크립트
트레이딩뷰의 진정한 정신에 따라, 이 스크립트의 작성자는 이를 오픈소스로 공개하여 트레이더들이 기능을 검토하고 검증할 수 있도록 했습니다. 작성자에게 찬사를 보냅니다! 이 코드는 무료로 사용할 수 있지만, 코드를 재게시하는 경우 하우스 룰이 적용된다는 점을 기억하세요.
🔍 Access Investing Strategies & Indicators
📊 whop.com/marktquant
🌐 marktquant.com
Nothing shared on this page constitutes financial advice. All information, tools, and analyses are provided solely for informational and educational purposes.
📊 whop.com/marktquant
🌐 marktquant.com
Nothing shared on this page constitutes financial advice. All information, tools, and analyses are provided solely for informational and educational purposes.
면책사항
해당 정보와 게시물은 금융, 투자, 트레이딩 또는 기타 유형의 조언이나 권장 사항으로 간주되지 않으며, 트레이딩뷰에서 제공하거나 보증하는 것이 아닙니다. 자세한 내용은 이용 약관을 참조하세요.
오픈 소스 스크립트
트레이딩뷰의 진정한 정신에 따라, 이 스크립트의 작성자는 이를 오픈소스로 공개하여 트레이더들이 기능을 검토하고 검증할 수 있도록 했습니다. 작성자에게 찬사를 보냅니다! 이 코드는 무료로 사용할 수 있지만, 코드를 재게시하는 경우 하우스 룰이 적용된다는 점을 기억하세요.
🔍 Access Investing Strategies & Indicators
📊 whop.com/marktquant
🌐 marktquant.com
Nothing shared on this page constitutes financial advice. All information, tools, and analyses are provided solely for informational and educational purposes.
📊 whop.com/marktquant
🌐 marktquant.com
Nothing shared on this page constitutes financial advice. All information, tools, and analyses are provided solely for informational and educational purposes.
면책사항
해당 정보와 게시물은 금융, 투자, 트레이딩 또는 기타 유형의 조언이나 권장 사항으로 간주되지 않으며, 트레이딩뷰에서 제공하거나 보증하는 것이 아닙니다. 자세한 내용은 이용 약관을 참조하세요.