PROTECTED SOURCE SCRIPT
PpSigan ZigZag++
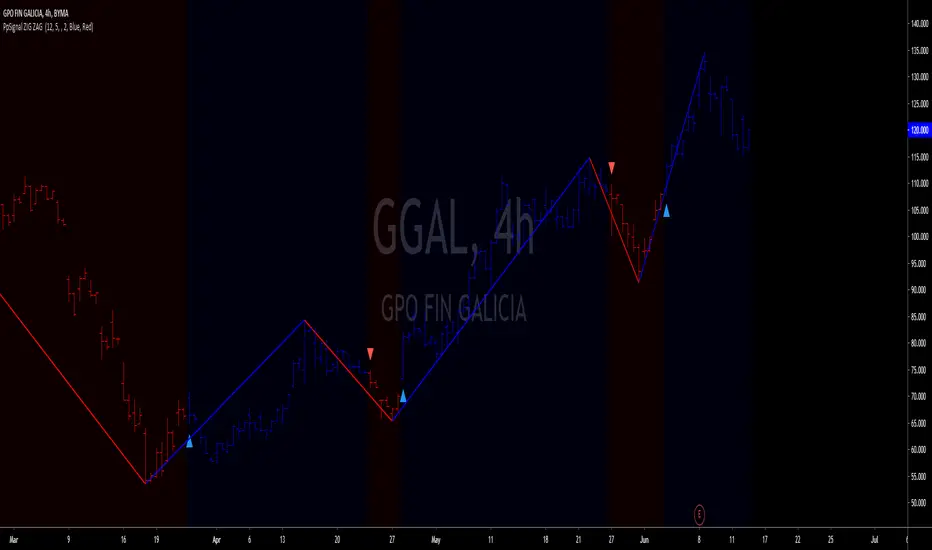
The Zig Zag indicator plots points on the chart whenever prices reverse by a percentage greater than a pre-chosen variable. Straight lines are then drawn, connecting these points. The indicator is used to help identify price trends. It eliminates random price fluctuations and attempts to show trend changes. Zig Zag lines only appear when there is a price movement between a swing high and a swing low that is greater than a specified percentage; often 5%. By filtering minor price movements, the indicator makes trends easier to spot in all time frames.
Buy when the price is blue or green choose your favorite up color and arrow is up.
sell when the price is red or orange choose your favorite up color and arrow is up.
Buy when the price is blue or green choose your favorite up color and arrow is up.
sell when the price is red or orange choose your favorite up color and arrow is up.
보호된 스크립트입니다
이 스크립트는 비공개 소스로 게시됩니다. 하지만 이를 자유롭게 제한 없이 사용할 수 있습니다 – 자세한 내용은 여기에서 확인하세요.
면책사항
해당 정보와 게시물은 금융, 투자, 트레이딩 또는 기타 유형의 조언이나 권장 사항으로 간주되지 않으며, 트레이딩뷰에서 제공하거나 보증하는 것이 아닙니다. 자세한 내용은 이용 약관을 참조하세요.
보호된 스크립트입니다
이 스크립트는 비공개 소스로 게시됩니다. 하지만 이를 자유롭게 제한 없이 사용할 수 있습니다 – 자세한 내용은 여기에서 확인하세요.
면책사항
해당 정보와 게시물은 금융, 투자, 트레이딩 또는 기타 유형의 조언이나 권장 사항으로 간주되지 않으며, 트레이딩뷰에서 제공하거나 보증하는 것이 아닙니다. 자세한 내용은 이용 약관을 참조하세요.