INVITE-ONLY SCRIPT
업데이트됨 S-R Zones & SH-SL by YSTC
This is a PAID Indicator from Volume Profile and VWAP Pack.
According to payment you will either get a TradingView account with indicators activated or
Have to send an email to contact@ystc.in with the email you used to sign up with us, and with your TradingView Username.
The script is available (for free) to YSTC's Course members of "Trading with PAV".
Overview (Support and Resistance - Supply and Demand)
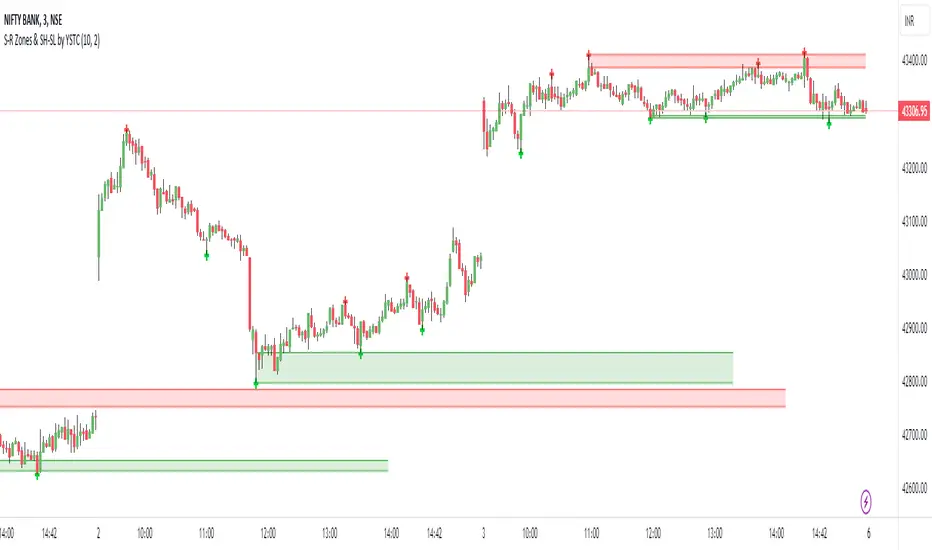
The support and resistance indicator is a technical indicator that will plot the support zone and resistance zone on the candlestick chart. It determines the price touches to find the strong support resistance zones.
The support and resistance indicator is the most basic technical analysis in trading. Instead of drawing zones manually, this indicator can save you time by plotting zones automatically.

Working
There are specific characteristics of a valid support and resistance zone. Price always bounces upward from the support zone while it bounces downward from the resistance zone. On the other hand, when a breakout of the support or resistance zone happens, the price trends toward the breakout.
Valid support zone
When the price touches a zone two to three times and bounces in a bullish direction, it is a good support zone.
The main point is that you should always find the bounces in clear price swings. The touches or bounces of the price must not be in the form of a choppy market. Price always moves in the form of swings or waves.

Valid resistance zone
When the price touches a zone two to three times with a bounce in a bearish direction, then a valid resistance zone forms.
Here the price bounces must be in the form of swings or waves. You must avoid a choppy market.
So the support and resistance zone indicator finds these parameters on the chart and draws only valid zones.

Settings of indicator

There are two inputs available in the indicator.
Number Of Bars For Swing High-Low
The number of bars for the swing bars represents the size of the swing for a valid support or resistance touch. This parameter helps to filter the ranging price. the default value is 10.
No of Tests for a Valid S and R Level
In this indicator, the number of pivots represents the support or resistance touches. so if you select the number 3, the indicator will only draw a zone with three touches.
Features
There are the following features that this indicator identifies automatically, so you don’t need to do manual work.
We are constantly adding new feature to improve S-R zones like how we taught in our course, so expect those in the next update.
Warning!!
This Indicator is work in progress. So TRUST the Swing High/Low and Manual Plotting until we improve this indicator Expect Errors. When this indicator is out of Development phase will removing this warning.
You can add this script to your chart by clicking "Add to favorite indicators" below.
Have Questions ?
contact@ystc.in
Free Stock Market Introduction Available.
Name: Yogesh Patil (YS Trading Coach).
Contact: +91 9637070868.
Time: Monday to Friday (10:00 AM - 07:00 PM).
According to payment you will either get a TradingView account with indicators activated or
Have to send an email to contact@ystc.in with the email you used to sign up with us, and with your TradingView Username.
The script is available (for free) to YSTC's Course members of "Trading with PAV".
Overview (Support and Resistance - Supply and Demand)
The support and resistance indicator is a technical indicator that will plot the support zone and resistance zone on the candlestick chart. It determines the price touches to find the strong support resistance zones.
The support and resistance indicator is the most basic technical analysis in trading. Instead of drawing zones manually, this indicator can save you time by plotting zones automatically.
Working
There are specific characteristics of a valid support and resistance zone. Price always bounces upward from the support zone while it bounces downward from the resistance zone. On the other hand, when a breakout of the support or resistance zone happens, the price trends toward the breakout.
Valid support zone
When the price touches a zone two to three times and bounces in a bullish direction, it is a good support zone.
The main point is that you should always find the bounces in clear price swings. The touches or bounces of the price must not be in the form of a choppy market. Price always moves in the form of swings or waves.
Valid resistance zone
When the price touches a zone two to three times with a bounce in a bearish direction, then a valid resistance zone forms.
Here the price bounces must be in the form of swings or waves. You must avoid a choppy market.
So the support and resistance zone indicator finds these parameters on the chart and draws only valid zones.
Settings of indicator
There are two inputs available in the indicator.
Number Of Bars For Swing High-Low
The number of bars for the swing bars represents the size of the swing for a valid support or resistance touch. This parameter helps to filter the ranging price. the default value is 10.
No of Tests for a Valid S and R Level
In this indicator, the number of pivots represents the support or resistance touches. so if you select the number 3, the indicator will only draw a zone with three touches.
Features
There are the following features that this indicator identifies automatically, so you don’t need to do manual work.
- Identify the valid support and resistance zones.
- Add the confluence of swings or waves during zone identification.
- Choppy market filter.
We are constantly adding new feature to improve S-R zones like how we taught in our course, so expect those in the next update.
Warning!!
This Indicator is work in progress. So TRUST the Swing High/Low and Manual Plotting until we improve this indicator Expect Errors. When this indicator is out of Development phase will removing this warning.
You can add this script to your chart by clicking "Add to favorite indicators" below.
Have Questions ?
contact@ystc.in
Free Stock Market Introduction Available.
Name: Yogesh Patil (YS Trading Coach).
Contact: +91 9637070868.
Time: Monday to Friday (10:00 AM - 07:00 PM).
릴리즈 노트
Minor Update.릴리즈 노트
Added Alerts For The Detection Of Support And Resistance Zones초대 전용 스크립트
이 스크립트는 작성자가 승인한 사용자만 접근할 수 있습니다. 사용하려면 요청 후 승인을 받아야 하며, 일반적으로 결제 후에 허가가 부여됩니다. 자세한 내용은 아래 작성자의 안내를 따르거나 YSTradingCoach에게 직접 문의하세요.
이 비공개 초대 전용 스크립트는 스크립트 모더레이터의 검토를 거치지 않았으며, 하우스 룰 준수 여부는 확인되지 않았습니다. 트레이딩뷰는 스크립트의 작동 방식을 충분히 이해하고 작성자를 완전히 신뢰하지 않는 이상, 해당 스크립트에 비용을 지불하거나 사용하는 것을 권장하지 않습니다. 커뮤니티 스크립트에서 무료 오픈소스 대안을 찾아보실 수도 있습니다.
작성자 지시 사항
A PAID Indicator from Volume Profile and VWAP Pack. According to payment you will either get a TradingView account with indicators activated or Have to send an email to contact@ystc.in with the email you used to sign up with us, and your TV username.
면책사항
해당 정보와 게시물은 금융, 투자, 트레이딩 또는 기타 유형의 조언이나 권장 사항으로 간주되지 않으며, 트레이딩뷰에서 제공하거나 보증하는 것이 아닙니다. 자세한 내용은 이용 약관을 참조하세요.
초대 전용 스크립트
이 스크립트는 작성자가 승인한 사용자만 접근할 수 있습니다. 사용하려면 요청 후 승인을 받아야 하며, 일반적으로 결제 후에 허가가 부여됩니다. 자세한 내용은 아래 작성자의 안내를 따르거나 YSTradingCoach에게 직접 문의하세요.
이 비공개 초대 전용 스크립트는 스크립트 모더레이터의 검토를 거치지 않았으며, 하우스 룰 준수 여부는 확인되지 않았습니다. 트레이딩뷰는 스크립트의 작동 방식을 충분히 이해하고 작성자를 완전히 신뢰하지 않는 이상, 해당 스크립트에 비용을 지불하거나 사용하는 것을 권장하지 않습니다. 커뮤니티 스크립트에서 무료 오픈소스 대안을 찾아보실 수도 있습니다.
작성자 지시 사항
A PAID Indicator from Volume Profile and VWAP Pack. According to payment you will either get a TradingView account with indicators activated or Have to send an email to contact@ystc.in with the email you used to sign up with us, and your TV username.
면책사항
해당 정보와 게시물은 금융, 투자, 트레이딩 또는 기타 유형의 조언이나 권장 사항으로 간주되지 않으며, 트레이딩뷰에서 제공하거나 보증하는 것이 아닙니다. 자세한 내용은 이용 약관을 참조하세요.